The Fundamentals of Structuring Data

Categories:
 Written by:
Nathan Rosidi
Mastering data structuring is key to efficiently organizing, accessing and make sense of the vast amounts of data we interact with on a daily basis.
Despite popular belief, not all data is created equal. That’s why, the fundamentals of structuring data are not just important; they are a must-have in making sense of the large amount of data we face daily.
In this article, I will discuss various data types, provide real-world examples, and discuss techniques for data structuring. Let's start!
What's the Big Deal About Data Structures?
At its very essence, a data structure is a systematic way of storing and organizing arbitrary data.
Data Structures: Your Digital Organizing Guru
Assume you own a library with many different books. Without an appropriate system, locating an individual book can become a needle in a haystack. Like a library's catalog system, data structures organize the location of information to speed up and simplify finding that information.
Why Should You Care?
Data in the digital world is generated and consumed on an ongoing basis. Which can store this data and be fast to access/process (efficiency of the more common data structures ensures that)
Whether coding the next big app or trying to find that cat video you liked last week, efficient data structures have your back.
The Superpowers of Good Data Structures
- Speed Demon: They're like shortcuts for your data. Find what you need faster than you can say "binary search tree"!
- Growth Spurt Ready: They can handle your data even when it decides to have a growth spurt. There will be no growing pains here!
- Flexible Yoga Master: Different tasks? No problem! They're the yoga masters of the digital world, bending to fit your needs.
Let’s say you are tracking user clicks on the website. With the right data structure, you are not just collecting clicks. You are surfing the wave of user behavior!
The Data Structure Family Tree:
1. The Straight-Shooters (Linear Structures)
- Arrays: Like a neat line of ducks. Easy to count, easy to find.
- Linked Lists: Imagine a conga line where everyone only knows the next dancer.
2. The Complex Cousins (Non-linear Structures)
- Trees: Family trees for your data. Hierarchical and branching out.
- Graphs: Think social networks. Everything's connected, just like in Kevin Bacon's world!
Why Bother Learning This Stuff?
Because in the digital age, data is king, queen, and the entire royal court! Understanding data structures is like having a backstage pass to how information is organized and accessed digitally. It's not just for tech geeks but anyone who wants to rule their digital domain efficiently.
Different Types of Data: A Safari Through the Information Wilderness

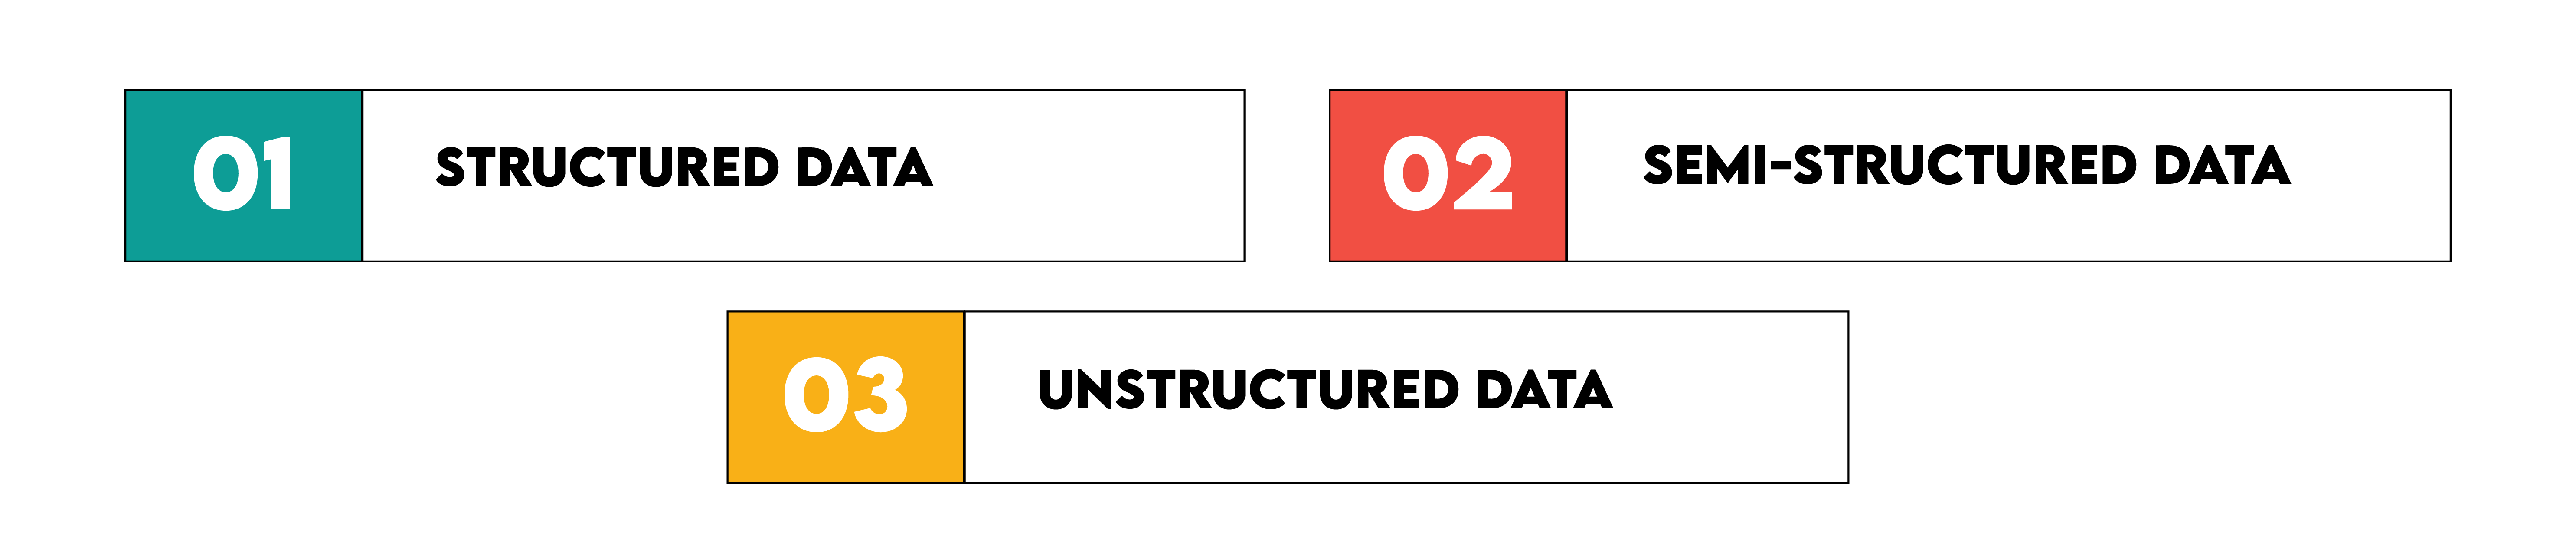
In real life, data can come in many different formats, each of them can suit different purposes. In this section, we’ll explore them, which are are structured, semi-structured and unstructured data!
Structured Data: The Well-Behaved Penguins
What's their deal? These are high organized and easily searchable. Typically, they are stored with rows and columns.
Where to spot them:
- Excel Spreadsheets
- SQL Databases
- Pandas DataFrames
Semi-structured Data: The Playful Monkeys
What's their deal? They don’t fit the tables, howeer they have some organizational properties.
Where to find them:
- JSON
- XML
Unstructured Data: The Wild Elephants
What's their vibe? These gentle giants roam free, following no particular pattern. They're big, pretty, and a little difficult to handle!
Where to observe them:
- Text Documents
- Multimedia Files
Real-world Examples: Where Data Roams Free!
Wonderful, let’s see structured, semi-structured and unstructured data in action! Here we’ll define those data types by implementing them in Python.
Data Types in Their Natural Habitat: Structured Data
Imagine a bank where every transaction is filed in perfect order. That's structured data for you - organized, predictable, and ready for action!
Python Spotting Technique:
import pandas as pd

data = {
    'Timestamp': ['2024-07-28 10:00', '2024-07-28 11:00'],
    'Amount': [100.0, 150.0],
    'Account_Number': ['12345', '67890']
}
df = pd.DataFrame(data)
print(df)
Here is the output.

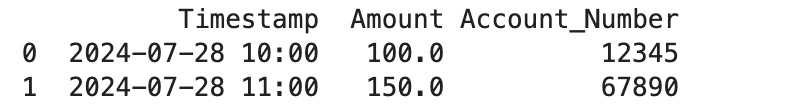
See how neatly they line up? That's the beauty of structured data!
Semi-structured Data: The Flexible Friend
Think of a social media post. It's got some structure (like user and timestamp), but it's also got room for creativity. It's the yoga instructor of the data world - structured, yet flexible!
Python Flexibility Showcase:
Let’s see the code.
import json

social_media_post = {
    "user": "john_doe",
    "timestamp": "2024-07-28T10:00:00Z",
    "content": "Loving the new features!",
    "likes": 123,
    "comments": [
        {"user": "jane_smith", "comment": "Me too!"},
        {"user": "alex_jones", "comment": "Awesome update!"}
    ]
}

json_data = json.dumps(social_media_post, indent=4)
print(json_data)
Here is the output.

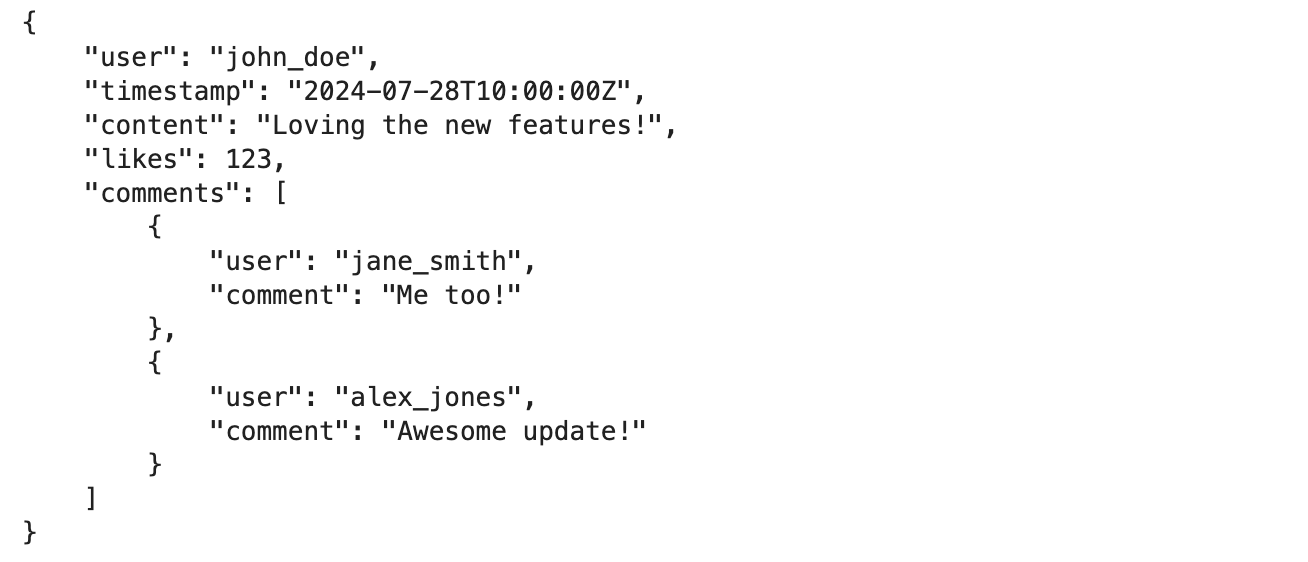
See that? It's got structure, but it's not afraid to nest and branch out. The data equivalent of a family tree!
Unstructured Data: The Free Spirit
Picture a customer review. It is honest, raw, and doesn't follow any rules. Unstructured material is like an artist who doesn't follow the rules.
Python Code for Customer Reviews:
Here is the code.
from nltk.tokenize import word_tokenize
from nltk.corpus import stopwords

review = "I absolutely love this product! It has exceeded all my expectations."

tokens = word_tokenize(review)

stop_words = set(stopwords.words('english'))
filtered_tokens = [word for word in tokens if word.lower() not in stop_words]
print(filtered_tokens)
Here is the output.


Look at that! We've just tamed the wild words of a customer review. It's like translating abstract art into something a computer can understand!
Data Structuring: Turning Data Chaos into Digital Zen
Ever tried to find your favorite shirt in a messy closet? That's what unstructured data feels like. Let's learn how to turn that data disaster into a well-organized digital wardrobe!
Key Techniques: Your Data Organizing Toolkit

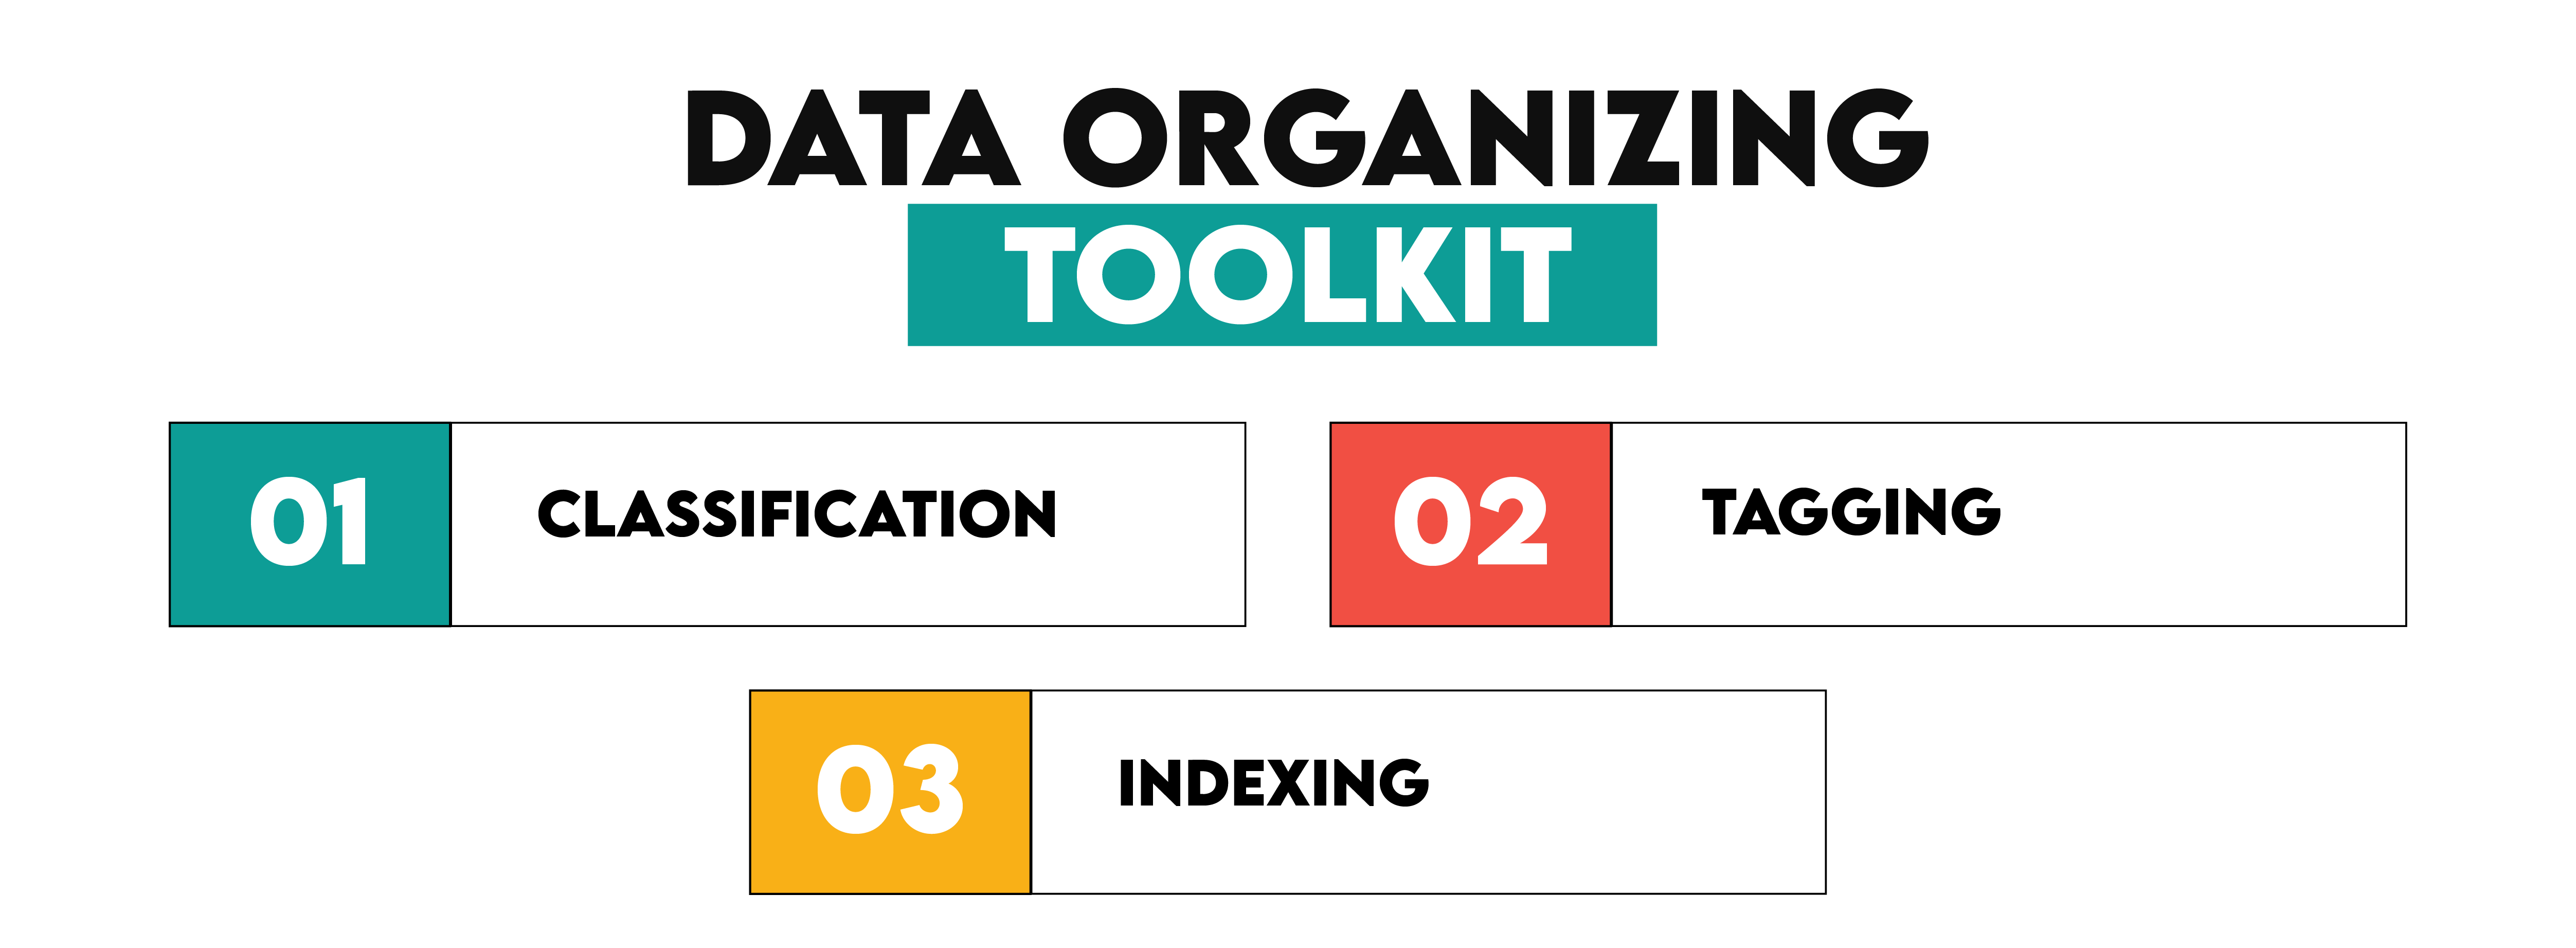
1. Classification: The art of sorting your digital socks into matching pairs.
2. Tagging: Like putting labels on your shirt hangers. "Casual Friday," anyone?
3. Indexing: Think of it as your closet's superhero, helping you find that red tie in a flash!
Classification: The Great Data Sorting Party
Imagine you're hosting a party where all your data gets to mingle and find its tribe. That's classification for you! Let’s see the code.
import pandas as pd

data = {
    'Product': ['Laptop', 'Smartphone', 'Tablet', 'Monitor'],
    'Category': ['Electronics', 'Electronics', 'Electronics', 'Accessories']
}
df = pd.DataFrame(data)
print(df)
Here is the output.

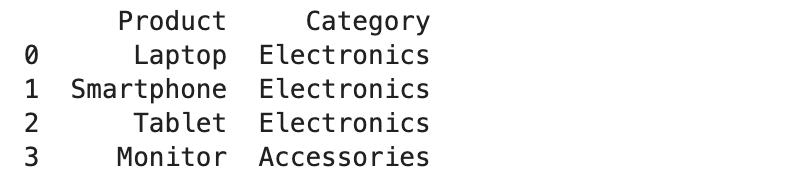
Look at that! Our data items found their besties. Laptops and smartphones hanging out in the 'Electronics' corner, while Monitor is chilling in 'Accessories'.
Tagging: The Data Gossip Game
Tagging is like giving your data items juicy gossip to share. It makes them more interesting and easier to find in the data party crowd.
Python Gossip Generator:
documents = [
    "Deep learning advancements in AI.",
    "Introduction to data science.",
    "Python for machine learning."
]

tagged_documents = [
    {"document": doc, "tags": ["AI", "Deep Learning"]} if "learning" in doc
    else {"document": doc, "tags": ["Data Science"]} if "data science" in doc
    else {"document": doc, "tags": ["Python", "Machine Learning"]}
    for doc in documents
]
print(tagged_documents)
Here is the output.


Now our documents are the life of the party, each with its own set of conversation starters!
Indexing: The VIP Fast Pass
Indexing is like giving your data a VIP pass to skip the long lines. It's all about getting to the good stuff faster!
Python VIP Treatment:
df = pd.DataFrame(data)

df.set_index('Product', inplace=True)
print(df)
Here is the output.


Boom! Now our 'Product' column is the bouncer, letting us quickly find any item without rummaging through the whole data club.
Common Data Structures: The Building Blocks of Digital Life
Welcome to the Data Structure Zoo! Let's meet the fascinating creatures that make up the digital ecosystem. Each has its own superpower, ready to solve your coding conundrums!
Arrays: The Lined-Up Lizards
Imagine a row of lizards, each holding a piece of data. That's an array for you! Fast, orderly, and always knows its place.
Python Array Wrangling:
df = pd.DataFrame(data)

df.set_index('Product', inplace=True)
print(df)
Here is the output.


Look at that! Our lizards lined up perfectly, and we can poke the third one whenever we want.
Linked Lists: The Circus Elephant Parade
Picture elephants in a circus, each holding the tail of the one in front. That's your linked list - flexible and always ready to squeeze in a new performer!
Python Elephant Trainer:
class Node:
    def __init__(self, data):
        self.data = data
        self.next = None

class LinkedList:
    def __init__(self):
        self.head = None

    def append(self, data):
        new_node = Node(data)
        if not self.head:
            self.head = new_node
            return
        last = self.head
        while last.next:
            last = last.next
        last.next = new_node

    def display(self):
        current = self.head
        while current:
            print(current.data, end=" -> ")
            current = current.next
        print("None")


ll = LinkedList()
ll.append(1)
ll.append(2)
ll.append(3)
ll.display()
Here is the output.


Our elephant parade is ready to march! Each knows who's next, making it easy to add new acts to the show.
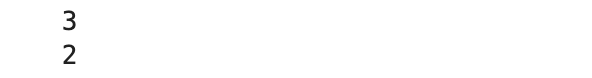
Stacks and Queues: The Cafeteria Line
Stacks are like a pile of trays - last one on top is the first to go. Queues? That's your typical lunch line - first come, first served!
Python Tray Stacker:
stack = []

stack.append(1)
stack.append(2)
stack.append(3)

print(stack.pop())
print(stack.pop())
Here is the output.

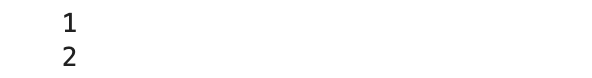
Python Lunch Line Simulator:
stack = []

stack.append(1)
stack.append(2)
stack.append(3)

print(stack.pop())
print(stack.pop())
Here is the output.
We'll help you whether you need to stack trays or run a lunch line!
Practical Example: Linked List Stack
Here is the link to this question: https://platform.stratascratch.com/algorithms/10436-linked-list-stack?
In this question, amazon asked us to implement stack using a linked list. We already have seen linked lists and stacks, so why can’t we combine them?
Here are the steps we must follow;
- Define the node and stack classes
- Node initialization
- Stack operations
- Process operation methods
- Create stack and process operations
Let’s see the code.
def create_stack(input_data):
    class Node:
        def __init__(self, data):
            self.data = data
            self.next = None

    class Stack:
        def __init__(self):
            self.head = None

        def is_empty(self):
            return self.head is None

        def push(self, data):
            new_node = Node(data)
            new_node.next = self.head
            self.head = new_node

        def pop(self):
            if self.is_empty():
                return None
            popped_node = self.head
            self.head = self.head.next
            popped_node.next = None
            return popped_node.data

        def peek(self):
            if self.is_empty():
                return None
            return self.head.data

        def process_operations(self, values, operations):
            output = []
            value_index = 0
            for operation in operations:
                if operation == "push" and value_index < len(values):
                    self.push(values[value_index])
                    value_index += 1
                elif operation == "pop":
                    result = self.pop()
                    if result is not None:
                        output.append(result)
                elif operation == "peek":
                    result = self.peek()
                    if result is not None:
                        output.append(result)
            return output

    values = input_data.get('values', [])
    operations = input_data.get('operations', [])

    stack_instance = Stack()
    return stack_instance.process_operations(values, operations)
Here are the test cases that we’ve used;
{"values": [1, 2, 3], "operations": ["push", "push", "push", "pop", "pop", "peek"]}
Here is the output.
Expected Output
Official output:
[3, 2, 1]Official output:
[5, 6]Official output:
[7, 9]Trees: The Family Reunion Diagram
Ever drawn a family tree? That's our tree data structure - branching out with parents, children, and crazy uncles!
Python Family Tree Builder:
class TreeNode:
    def __init__(self, data):
        self.data = data
        self.children = []

    def add_child(self, child_node):
        self.children.append(child_node)

    def display(self, level=0):
        print(' ' * level * 4 + str(self.data))
        for child in self.children:
            child.display(level + 1)


root = TreeNode('Root')
child1 = TreeNode('Child 1')
child2 = TreeNode('Child 2')
root.add_child(child1)
root.add_child(child2)
child1.add_child(TreeNode('Child 1.1'))
child2.add_child(TreeNode('Child 2.1'))
root.display()
Here is the output.

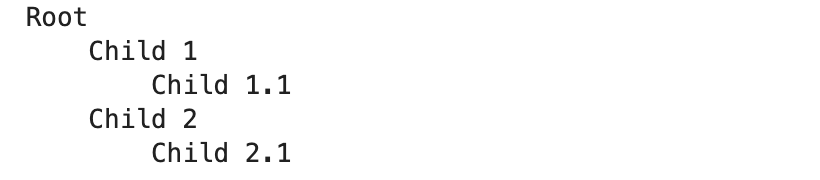
Look at that family tree grow! Root, children, grandchildren - all neatly organized.
Practical Example 2: Binary tree Traversal
Given a binary tree, return the zig-zag order traversal of its values, i.e., from left to right in level 0, then right to left in level 1, etc., alternating the direction between levels.
Here is the link to this question: https://platform.stratascratch.com/algorithms/10434-binary-tree-traversal?
As you can see amazon asks us to create a binary trees with different instructions.
Here is the code.
def zigzag_level_order_solution(tree_data):
    class tree_node:
        def __init__(self, val=0, left=None, right=None):
            self.val = val
            self.left = left
            self.right = right

    def list_to_tree(lst, idx=0):
        if idx < len(lst) and lst[idx] is not None:
            node = tree_node(lst[idx])
            node.left = list_to_tree(lst, 2 * idx + 1)
            node.right = list_to_tree(lst, 2 * idx + 2)
            return node
        return None

    def zigzag_level_order(root):
        if not root:
            return []

        result = []
        queue = [root]
        level = 0

        while queue:
            level_values = []
            size = len(queue)

            for _ in range(size):
                node = queue.pop(0)
                level_values.append(node.val)

                if node.left:
                    queue.append(node.left)
                if node.right:
                    queue.append(node.right)

            if level % 2 == 1:
                level_values.reverse()

            result.append(level_values)
            level += 1

        return result

    root = list_to_tree(tree_data)
    return zigzag_level_order(root)
Here are the test cases.
[3, 9, 20, null, null, 15, 7]Here is the output.
Expected Output
Official output:
[[3], [20, 9], [15, 7]]Official output:
[[1], [3, 2], [4, 5]]Official output:
[[1], [2], [3], [4]]Graphs: The Social Network Map
Imagine mapping out your friendships. Who knows who? That's a graph - a web of connections that can represent any relationship!
Python Friend Mapper:
class Graph:
    def __init__(self):
        self.graph = {}

    def add_edge(self, node, neighbor):
        if node not in self.graph:
            self.graph[node] = []
        self.graph[node].append(neighbor)

    def display(self):
        for node in self.graph:
            print(f'{node} -> {" -> ".join(self.graph[node])}')


g = Graph()
g.add_edge('A', 'B')
g.add_edge('A', 'C')
g.add_edge('B', 'D')
g.add_edge('C', 'D')
Here is the output.

And there's your social network! A knows B and C, B knows D, and so on. Six degrees of separation, anyone?
Mind Bender: Can you detect a graph whether it is a bipartite or not?
Practical Example 3: Bipartite Graph Detection
Determine if a graph is bipartite, given a list of its edges in form (u, v).
Here is the link to this question: https://platform.stratascratch.com/algorithms/10399-bipartite-graph-detection?
In this question, micorosft asked us to determine whether a graph is a bipartite or not, based on given a list of its edges in form (u,v).
Let’s see the steps of solving this question;
1. Construct the Graph
2. Initialize the color map
3. Dfs for color coding
4. Check for bipartites
5. Iterate through all nodes
Here is the code.
def is_bipartite(edges):
    graph = {}
    for u, v in edges:
        if u not in graph:
            graph[u] = []
        if v not in graph:
            graph[v] = []
        graph[u].append(v)
        graph[v].append(u)

    colors = {}

    def dfs(node, color):
        if node in colors:
            return colors[node] == color
        colors[node] = color
        for neighbor in graph[node]:
            if not dfs(neighbor, 1 - color):
                return False
        return True

    for node in graph:
        if node not in colors:
            if not dfs(node, 0):
                return False

    return True
Here are the test cases.
[[1, 2], [2, 3], [3, 4], [4, 1], [1, 3]]Here is the output.
Expected Output
Official output:
falseOfficial output:
trueOfficial output:
falseTechniques for Structuring Data: Turning Data Chaos into Digital Harmony

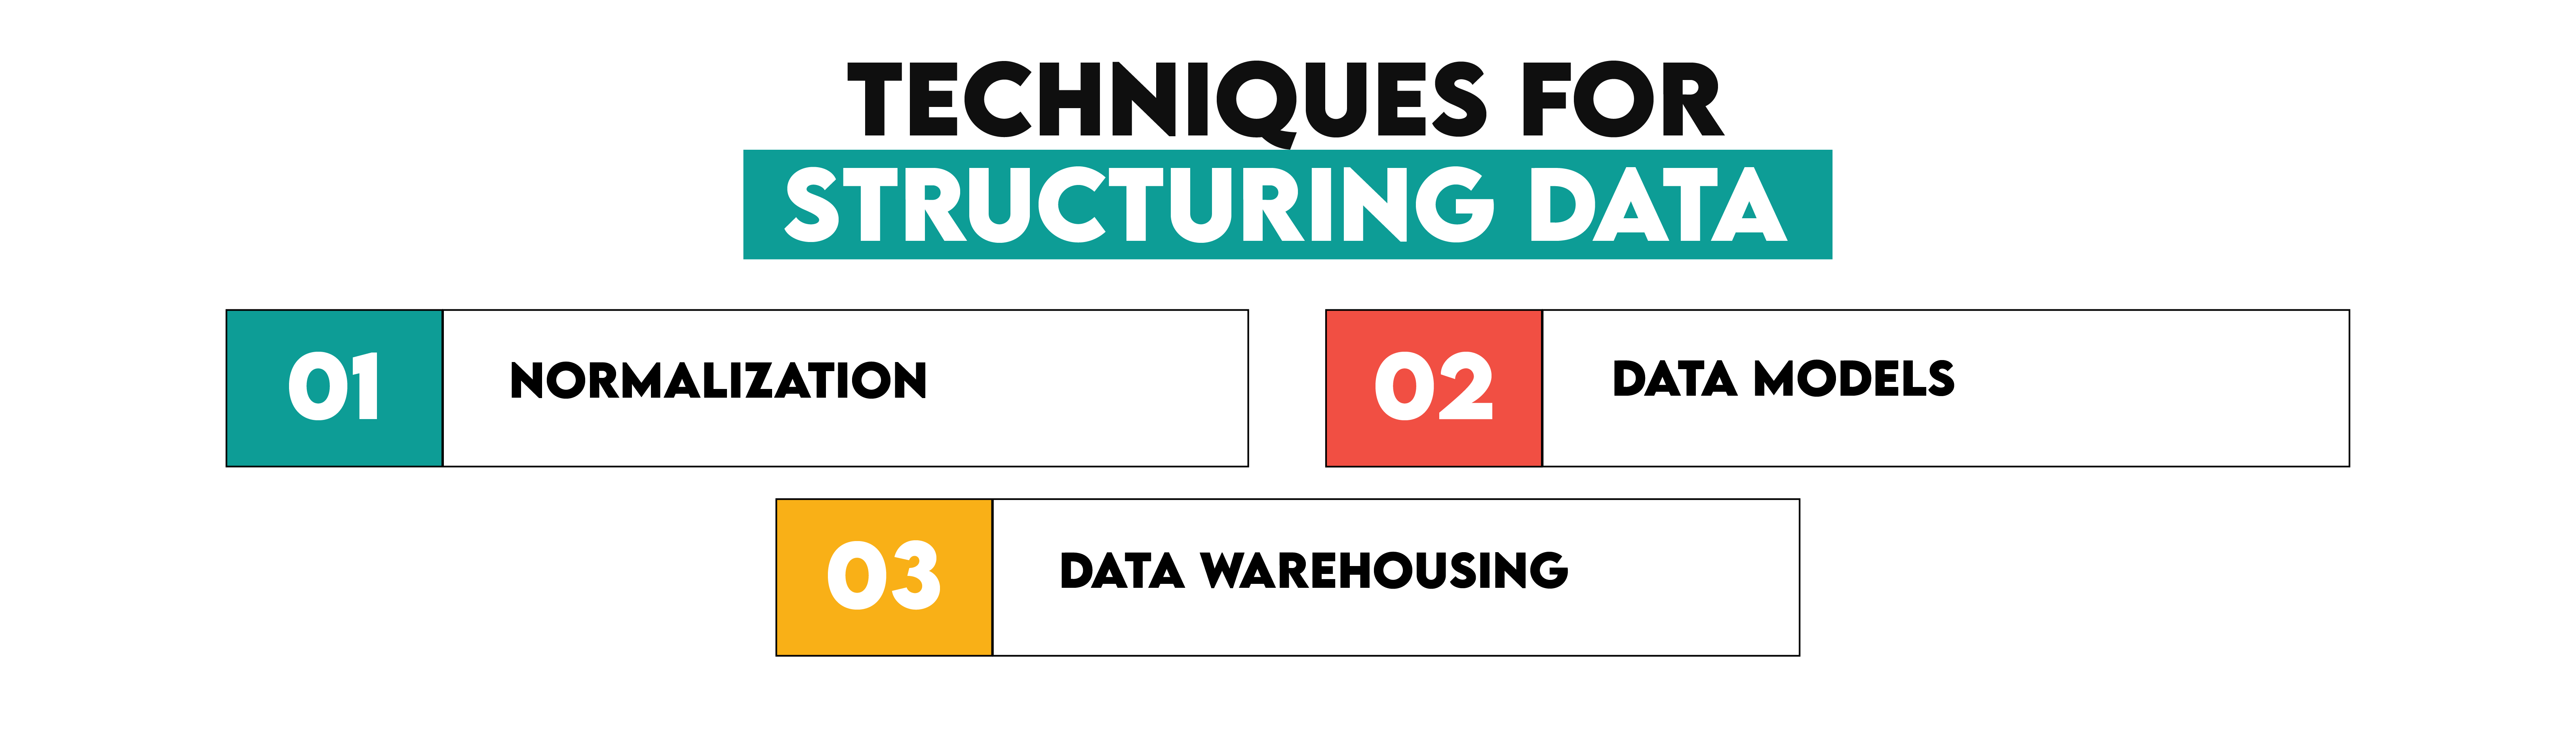
Data Structuring includes different techniquest. These are very important to maintain data integrity, reducing redundancy and optimizing performance. In this example, we’ll explore normaliation, data modeling and data warehousing.
Normalization: The Marie Kondo of Data
In database architecture, normalization is the technique used to lower data redundancy while increasing data integrity. It involves organizing a database's tables and fields to ensure dependency and redundancy are minimized.
Concept: Defining relationships between smaller, related tables created from a massive table.
In Data Science: In data science, you can have a table including consumer orders. You construct a separate customer database and link orders to consumers using a foreign key rather than keeping consumer data with every order.
Let's see this magic in action:
import pandas as pd


orders = {
    'OrderID': [1, 2],
    'CustomerName': ['John Doe', 'Jane Smith'],
    'CustomerAddress': ['123 Elm St', '456 Oak St'],
    'Product': ['Widget', 'Gizmo']
}

df_orders = pd.DataFrame(orders)
print("Unnormalized Data:")
print(df_orders)


customers = {
    'CustomerID': [1, 2],
    'CustomerName': ['John Doe', 'Jane Smith'],
    'CustomerAddress': ['123 Elm St', '456 Oak St']
}

df_customers = pd.DataFrame(customers)
print("\nCustomers Table:")
print(df_customers)

orders_normalized = {
    'OrderID': [1, 2],
    'CustomerID': [1, 2],
    'Product': ['Widget', 'Gizmo']
}

df_orders_normalized = pd.DataFrame(orders_normalized)
print("\nOrders Table:")
print(df_orders_normalized)

merged_data = pd.merge(df_orders_normalized, df_customers, on='CustomerID')
print("\nMerged Data:")
print(merged_data)
Here is the output.

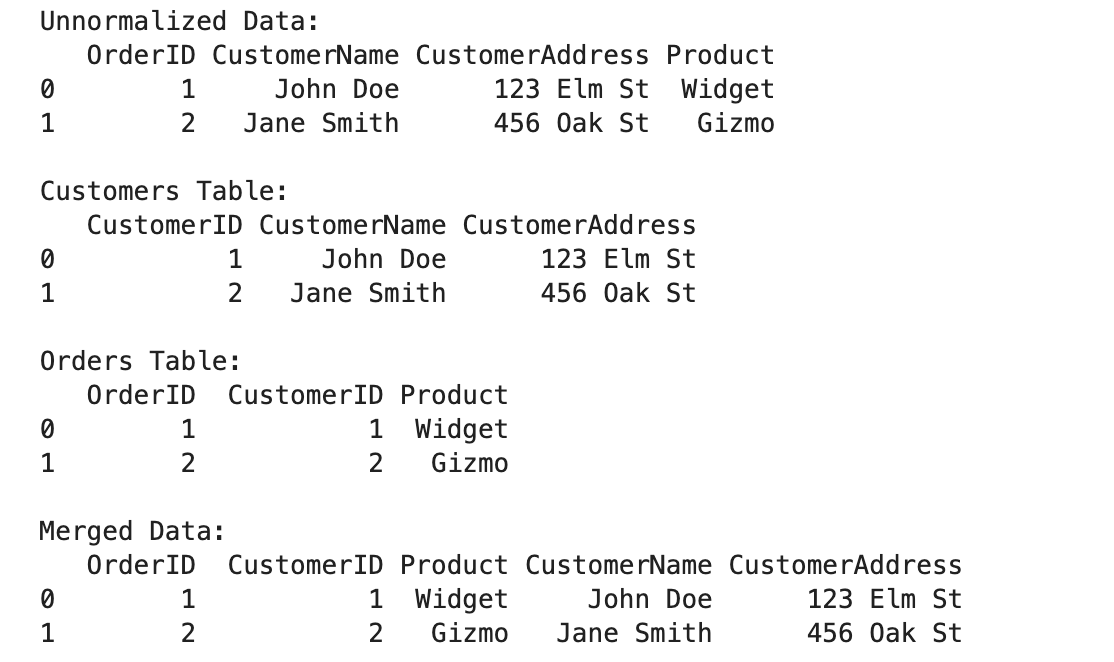
Look at that! We've gone from a jumbled mess to a neat, organized system. Marie Kondo would be proud!
Data Models: The Architect's Blueprint
Data models specify the connections and methods of processing of data. They act as a data organizing and structural plan.
Common Data Models:
1. Relational Model: Think of it as a fancy spreadsheet.
2. Document Model: Like a filing cabinet full of detailed folders.
3. Graph Model: Imagine a web of connections, perfect for mapping relationships.
Let's build a mini social network using a graph model:
import networkx as nx
import matplotlib.pyplot as plt


G = nx.Graph()


G.add_edge('Alice', 'Bob')
G.add_edge('Alice', 'Charlie')
G.add_edge('Bob', 'David')
G.add_edge('Charlie', 'David')


nx.draw(G, with_labels=True)
plt.show()
Here is the output.

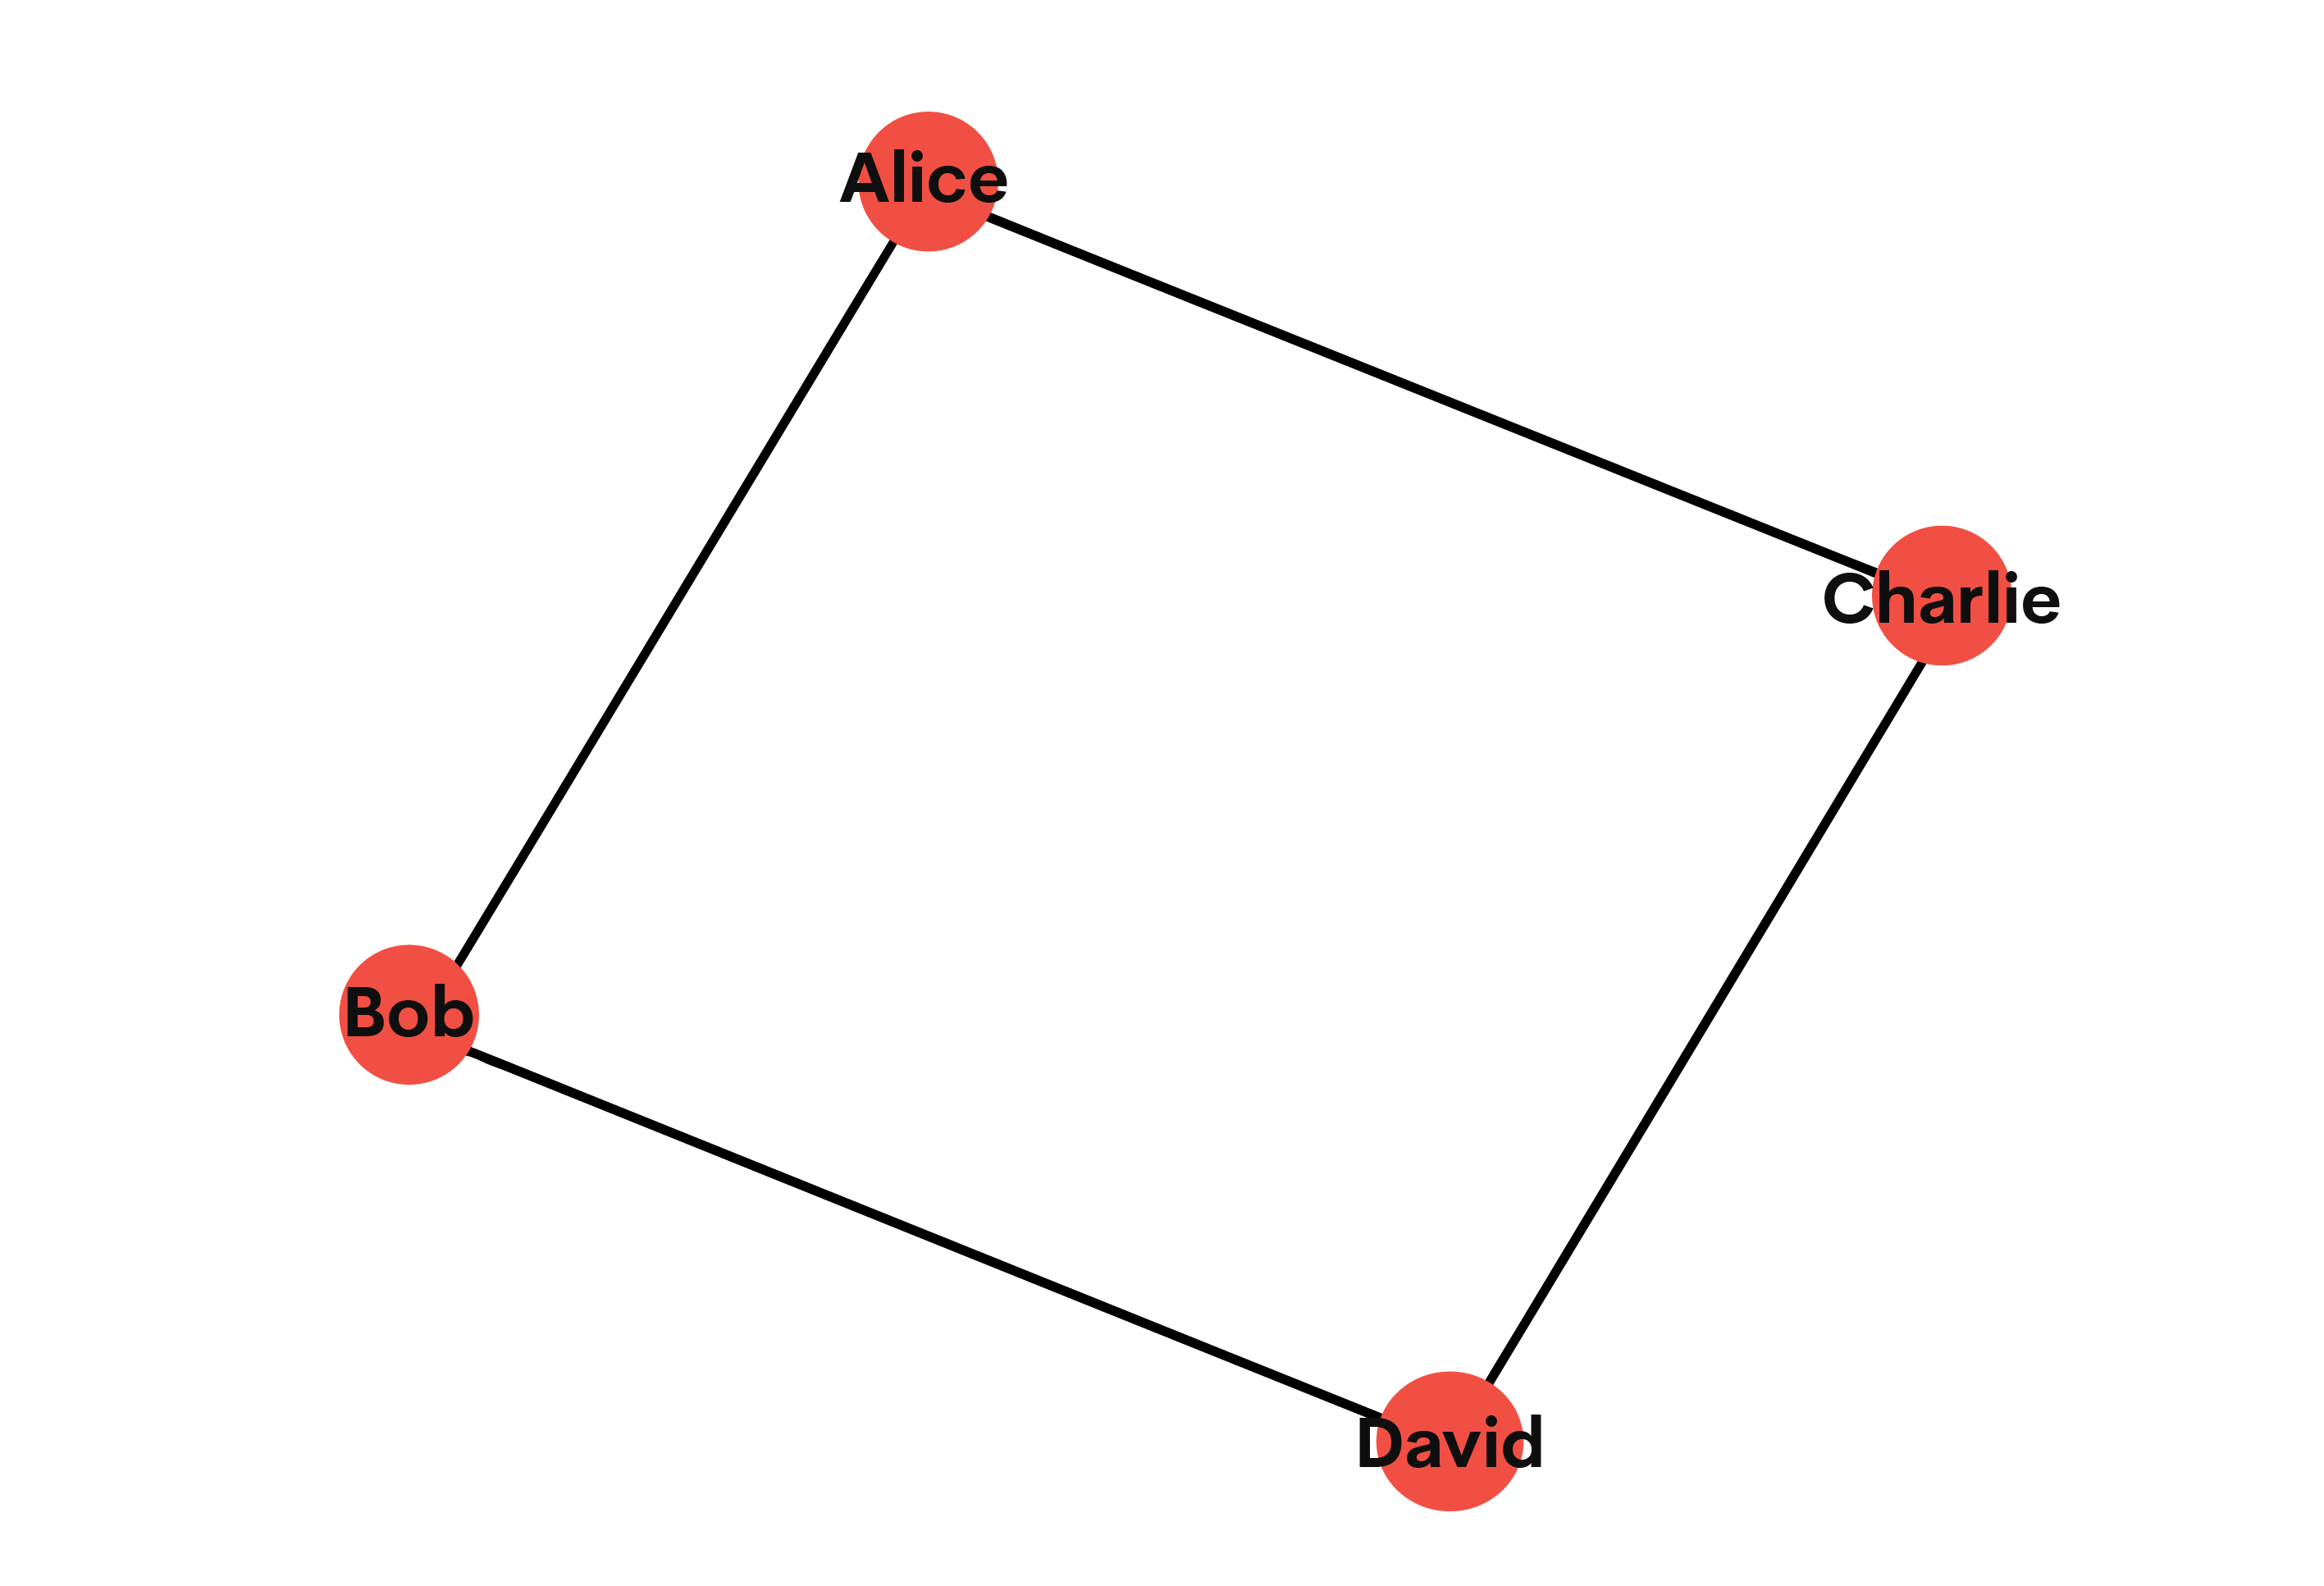
Voila! We've just mapped out a friendship circle. Who knew data could be so social?
Data Warehousing: The Grand Library of Information
Data warehousing is the gathering and organization of data from several sources intended to yield significant commercial insights. It backs up analysis and inquiry used in decision-making.
Let's combine sales data from different regions, like merging book collections from different libraries:
data_region1 = {
    'Region': ['North', 'North'],
    'Sales': [250, 300]
}

data_region2 = {
    'Region': ['South', 'South'],
    'Sales': [200, 250]
}


df_region1 = pd.DataFrame(data_region1)
df_region2 = pd.DataFrame(data_region2)


df_combined = pd.concat([df_region1, df_region2])
print("Combined Data:")
print(df_combined)
Here is the output.

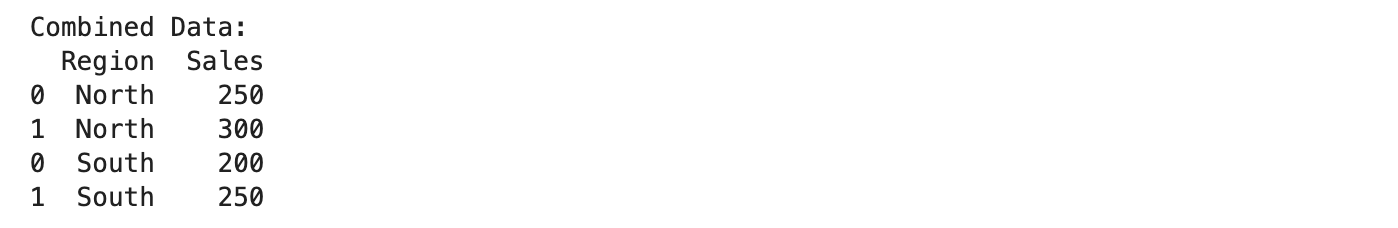
And just like that, we've created a mini data warehouse! Now we can see all our sales data in one place. Time to start analyzing those bestsellers!
Tools and Technologies: The Data Scientist's Magical Gadgets
Managing, processing, and analyzing data call for a range of techniques and technology. These instruments help with data organization, storage, and visualization, thereby simplifying the process of gaining understanding and guiding decisions.
Database Management Systems (DBMS): The Digital Fortress
A database system (DBMS) is software executing searches on data using a common approach of classifying and retrieving. Its methodical approach to data management makes storage, access, and manipulation simple.
Real-world scenario: You're building a user database for your app. SQLite comes to the rescue!
ETL Tools: The Data Alchemist's Workshop
ETL tools are like magical cauldrons where you throw in raw data and out comes gold! Extract, Transform, Load - it's not just a process, it's a data makeover montage!
Real-world scenario: You're combining user data from different sources. Pandas swoops in like a data-crunching superhero!
Python Pandas Potion:
import pandas as pd


data_source1 = {'Name': ['Alice', 'Bob'], 'Age': [30, 25]}
data_source2 = {'Name': ['Charlie', 'David'], 'Age': [35, 28]}
df1 = pd.DataFrame(data_source1)
df2 = pd.DataFrame(data_source2)

df_combined = pd.concat([df1, df2])
print("Transformed Data:")
print(df_combined)

print("Loaded Data:")
print(df_combined)
Here is the output.

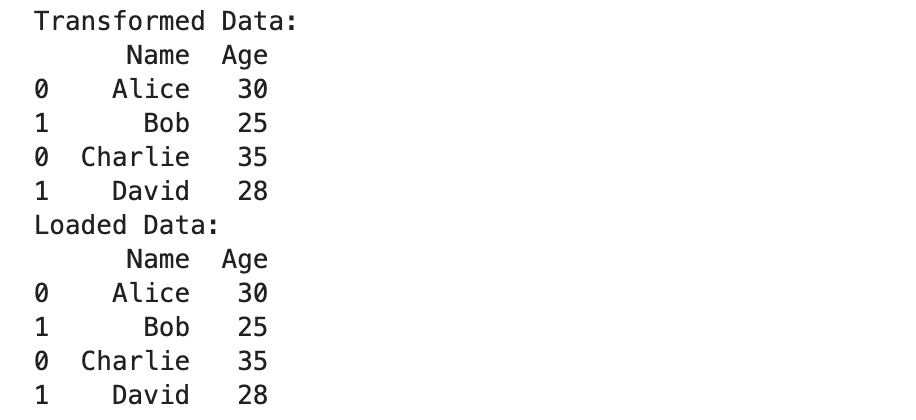
Abracadabra! Your scattered data sources have merged into one beautiful, organized dataframe. It's ETL magic at its finest!
Data Visualization Tools: The Crystal Ball of Insights
Data visualization tools enable the creation of graphical depictions of data, therefore facilitating analysis and understanding of it.
Real-world scenario: You need to show user age distribution. Matplotlib steps up to paint your data picture!
Python Matplotlib Masterpiece:
import matplotlib.pyplot as plt

names = ['Alice', 'Bob', 'Charlie', 'David']
ages = [30, 25, 35, 28]

plt.bar(names, ages)
plt.xlabel('Names')
plt.ylabel('Ages')
plt.title('Ages of Users')
plt.show()
Here is the output.

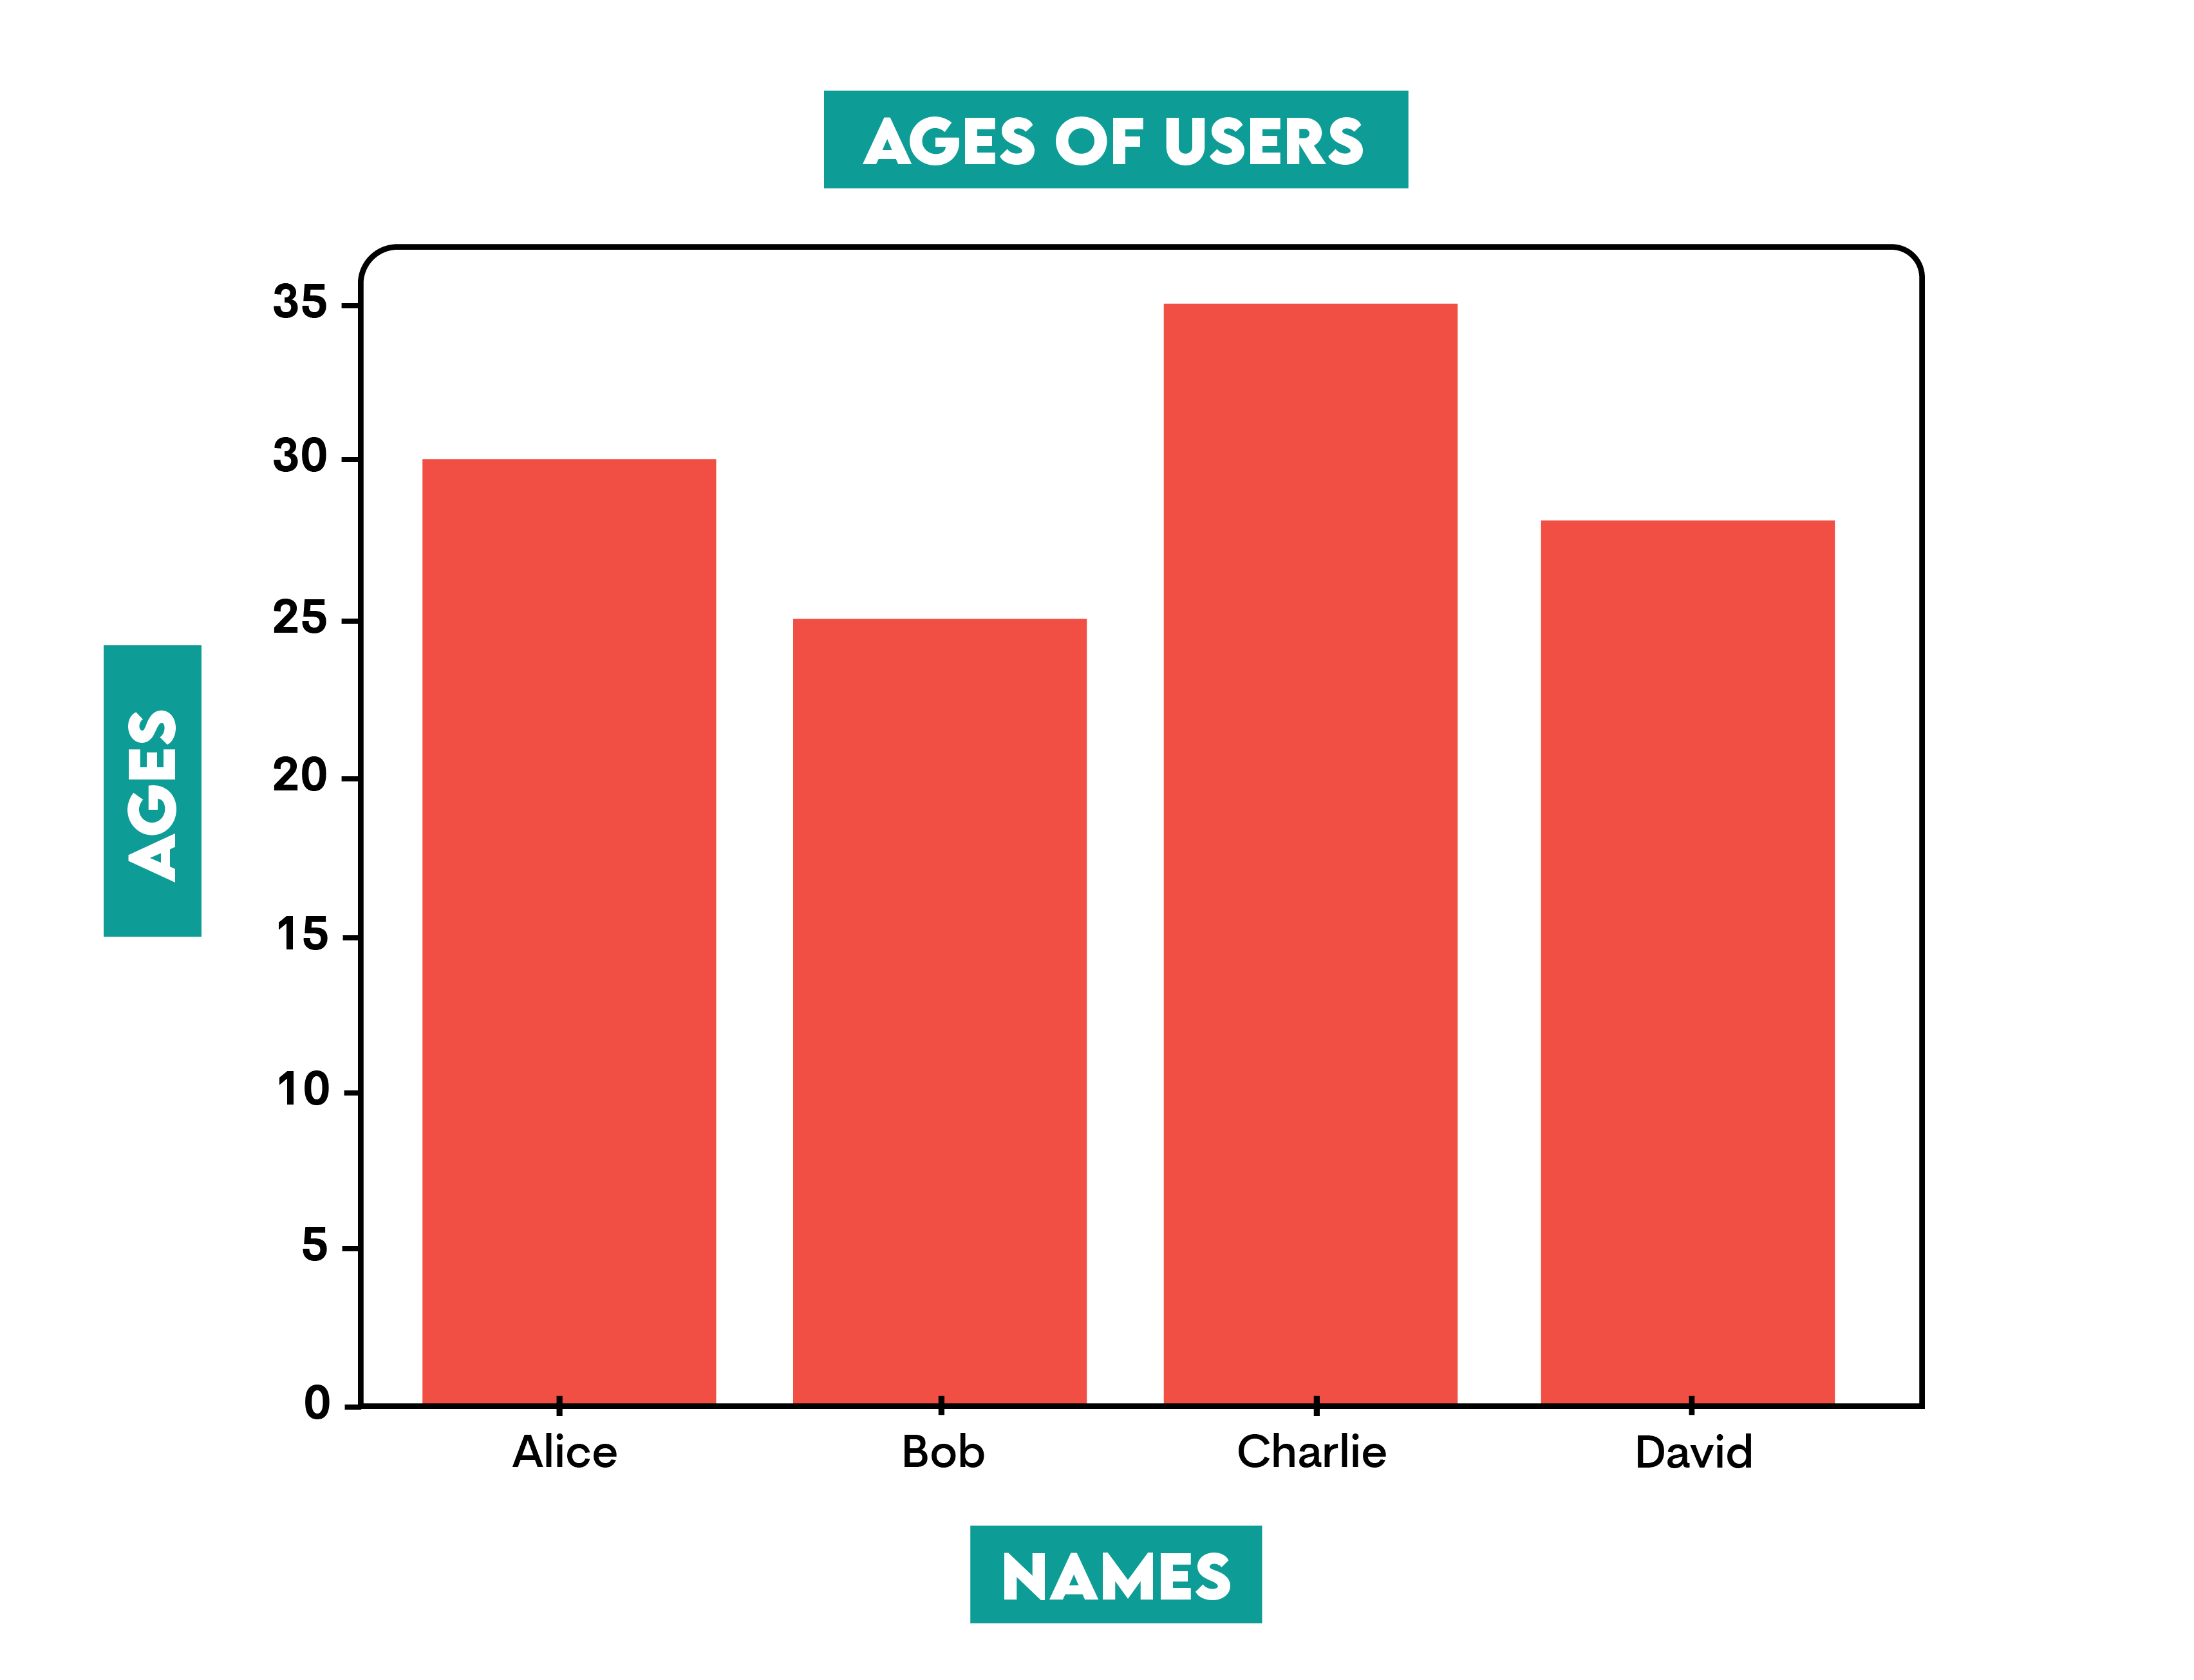
Output: A dazzling bar chart displaying the ages of users, turning raw numbers into a visual feast!
Best Practices: The Secret Sauce of Data Excellence
Following best standards in data structure guarantees that your data stays clear, effective, and simple to utilize. These techniques support good data integrity maintenance, performance optimization, and efficient data analysis capability.
Data Validation: The Great Data Cleanse
Think of data validation as giving your data a spa day. It's all about scrubbing away the impurities and leaving only the squeaky-clean truth behind.
Real-world scenario: You've got a user database, but it's messier than a teenager's room. Time for some Python-powered cleaning!
The Great Data Purification Ritual:
import pandas as pd

data = {
    'Name': ['Alice', 'Bob', None, 'David'],
    'Age': [30, -5, 25, 40],
    'Email': ['alice@example.com', 'bob@example', 'charlie@example.com', None]
}

df = pd.DataFrame(data)
print("Original Data:")
print(df)

df = df.dropna()

df = df[df['Age'] > 0]

df = df[df['Email'].str.contains('@', na=False)]

print("\nValidated Data:")
print(df)
Here is the output.

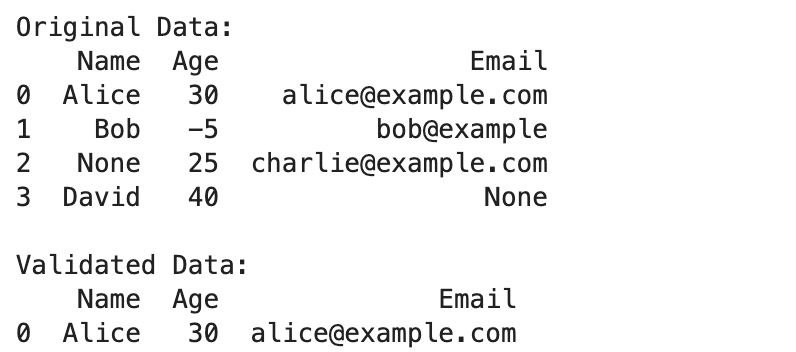
Behold! Your data has been purified. No more missing names, negative ages, or suspicious emails. It's data hygiene at its finest!
Consistent Naming Conventions: The Art of Data Linguistics
Imagine if everyone spoke a different language in your code. Chaos, right? Consistent naming is like establishing a universal language for your data kingdom.
The Naming Harmony Spell:
def calculate_average_age(users):
    total_age = sum(user['age'] for user in users)
    average_age = total_age / len(users)
    return average_age

users = [
    {'name': 'Alice', 'age': 30},
    {'name': 'Bob', 'age': 25},
    {'name': 'Charlie', 'age': 35}
]

average_age = calculate_average_age(users)
print(f"Average Age: {average_age}")
Here is the output.


See how everything flows smoothly? It's like poetry for your code!
Regular Backups: The Data Time Machine
Backups are your insurance against digital disasters. It's like having a time machine for your data!
The Backup Enchantment:
import shutil
import os

# Create a sample file
file_path = 'example.db'
with open(file_path, 'w') as file:
    file.write("This is a sample database file.")

# Create a backup of a file
def create_backup(file_path):
    backup_path = file_path + '.bak'
    shutil.copy(file_path, backup_path)
    print(f"Backup created at {backup_path}")

# Example usage
if os.path.exists(file_path):
    create_backup(file_path)
else:
    print("File not found!")

# Checking if the backup was created
if os.path.exists(file_path + '.bak'):
    print("Backup verification: Backup file exists.")
else:
    print("Backup verification: Backup file does not exist.")
Here is the output.


Of course here, we first created database but you get the idea!
Documentation: The Chronicles of Code
Good documentation is like leaving a treasure map for future explorers (including future you). It's the difference between "What does this do?" and "Aha! That's how it works!"
The Documentation Scroll:
def calculate_average_age(users):
    """
    Calculate the average age of a list of users.

    Args:
        users (list): A list of dictionaries with user information.

    Returns:
        float: The average age of the users.
    """
    total_age = sum(user['age'] for user in users)
    average_age = total_age / len(users)
    return average_age

users = [
    {'name': 'Alice', 'age': 30},
    {'name': 'Bob', 'age': 25},
    {'name': 'Charlie', 'age': 35}
]

average_age = calculate_average_age(users)
print(f"Average Age: {average_age}")
Here is the output.

Data Security: The Digital Fort Knox
In a world of data bandits, your data needs armor. It's time to build a fortress around your precious information!
The Encryption Spell:
from cryptography.fernet import Fernet

key = Fernet.generate_key()
cipher_suite = Fernet(key)

data = b"Sensitive data"
encrypted_data = cipher_suite.encrypt(data)
print(f"Encrypted Data: {encrypted_data}")
decrypted_data = cipher_suite.decrypt(encrypted_data)
print(f"Decrypted Data: {decrypted_data}")
Here is the output.


Abracadabra! Your data is now as secure as a dragon's treasure hoard.
Challenges in Data Structuring: Welcome to the Data Thunderdome!
Effective data structure might present difficulties for several reasons. Knowing these difficulties helps one to develop and apply improved data management techniques.
Data Volume: The Gigantic Data Glacier
The Challenge: Managing plenty of data can be difficult. Data's complexity in storing, organizing, and processing increases as well.
The Solution: Large datasets challenge memory capacity, which slows down processing and increases resource-intensive demand.
Data Variety: The Format Fiesta
The Challenge: Integration of data from several sources—e.g., JSON, CSV, databases—can be difficult.
The Solution: Pandas and other tools help import and merge several data formats into a single structure for analysis.
Data Quality: The Messy Data Monster
The Challenge: Inaccurate or incomplete data might cause erroneous analysis and findings.
The Solution: Use data validation and cleansing techniques to manage missing numbers, eliminate repetitions, and fix mistakes.
Data Integration: The Puzzle Piece Predicament
The Challenge: Because of variations in data formats, structures, and semantics, combining data from many sources can be challenging.
The Solution: Combining data using several formats and structures calls for careful mapping and transformation.
Data Security: The Digital Fort Knox
The Challenge: Data breaches challenge valuable data and cause major losses.
The Solution: Apply encryption and other security policies to protect data against illegal access and leaks.
Conclusion
As you understand by know, structured data is the backbone of data related tasks, so if you want to be a part of data driven job, understanding these data structuring techniques is must.
Mastering these techniques, structures and tools will give you very important skillset. If you want to go one step further, check out our algorithm questions, which will help you understanding those tasks and also make you ready and confident to the interviews. Visit our platform to see those questions, see you there!
Share