T-Test or Z-Test for R: Which Should You Use?

 Written by:
Nathan Rosidi
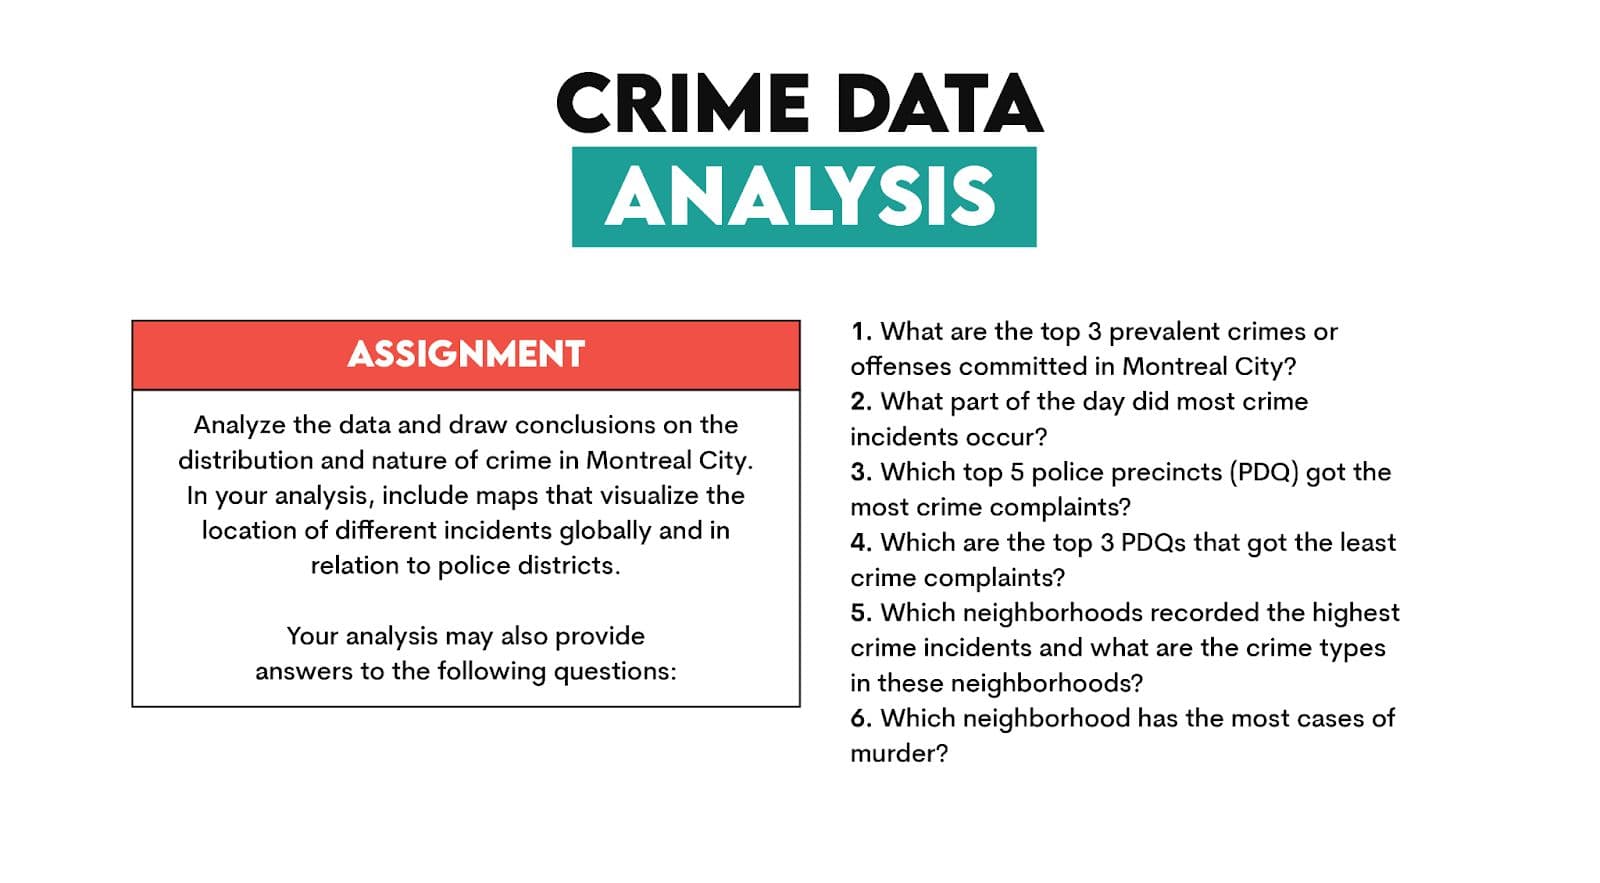
T-test vs. Z-test in crime data analysis: A comprehensive guide to choosing the right statistical method for comparing crime trends, means, and proportions
What if I say the crimes can be forecasted before they happen? Of course, we are not entirely in the Minority Report movie, but you get the idea!
In this article, we will use crime data from Montreal. But to forecast crime, should we use a T-test or a Z-test? Well, this article will answer this question too, and you will know when to use which in the future! So, let’s get started!
Can Crime Be Forecasted Using T-test or Z-test?
In this article, we will use the Montreal Crime Dataset. This dataset provides information on how crime spreads over time, where it happens, and what kinds of crime occur. Here is the link to the dataset.
Before jumping into hypothesis testing, let’s explore this dataset first and see what insights we can extract.
Exploring the Dataset for T-test and Z-test Applications
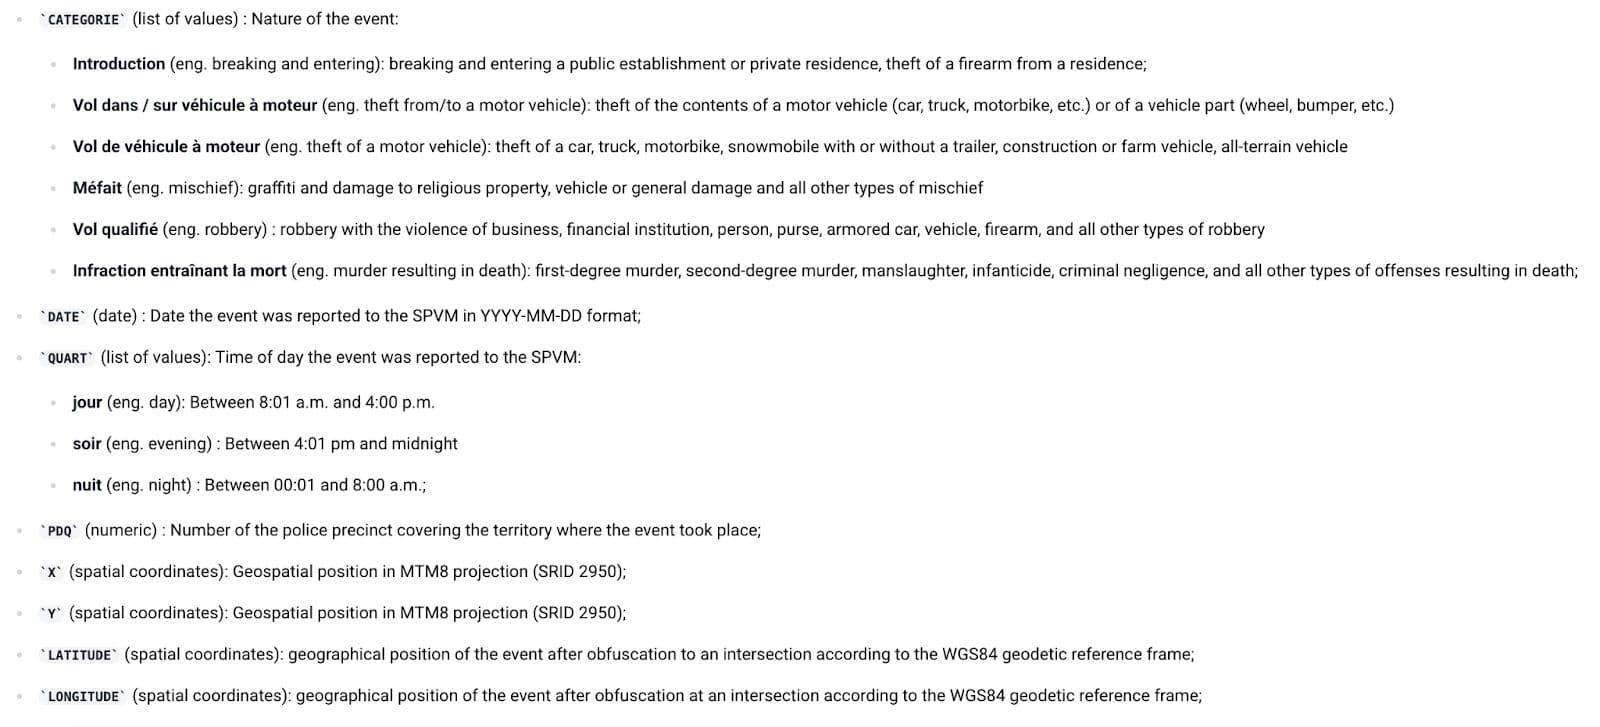
This dataset from the Service de police de la Ville de Montréal (SPVM) records criminal acts reported in the city. So let’s discover the data dictionary first. Here is the data dictionary for our dataset.
Hypothesis Testing in Crime Data: When to Use a T-test vs. a Z-test
We can compare crime rates between different time periods (T-test) and check whether the proportion of a specific crime type varies across precincts (Z-test).
Our dataset allows us to apply statistical tests to real-world crime analysis, helping to identify patterns and trends. Let’s start with the T-test to crime data analysis with this understanding.
T-test in Crime Data Analysis
Let’s build a t-test first! Here is our hypothesis, which we are going to test.
Example Hypothesis:
Do crime rates differ significantly between daytime and nighttime?
- Null Hypothesis (H₀): There is no significant difference in the average number of crimes reported during the day and at night.
- Alternative Hypothesis (H₁): The average number of crimes reported during the day significantly differs from those at night.
How to Perform a T-test in Crime Data Analysis
- Filter the dataset to extract crime records for daytime ("jour") and nighttime ("nuit").
- Count the number of crimes reported for each category during the day and at night.
- Convert the counts into numerical vectors for statistical analysis.
- Perform an independent T-test to compare the means of the two groups.
- Interpret the T-statistic and P-value to determine whether the difference is statistically significant.
Here is the code.
library(dplyr)
df <- read.csv("actes-criminels.csv", stringsAsFactors = FALSE)
day_crimes <- df %>% filter(QUART == "jour") %>% count(CATEGORIE)
night_crimes <- df %>% filter(QUART == "nuit") %>% count(CATEGORIE)
day_counts <- day_crimes$n
night_counts <- night_crimes$n
t_test_result <- t.test(day_counts, night_counts, var.equal = FALSE)
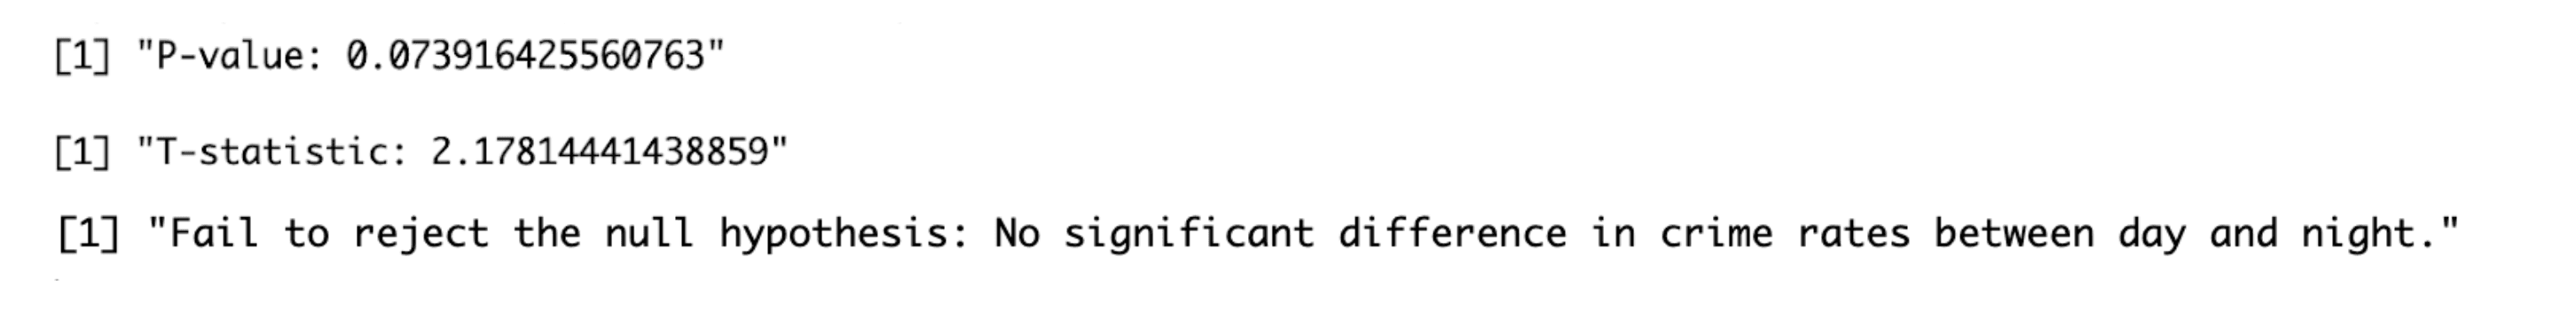
print(paste("T-statistic:", t_test_result$statistic))
print(paste("P-value:", t_test_result$p.value))
alpha <- 0.05
if (t_test_result$p.value < alpha) {
print("Reject the null hypothesis: Crime rates differ significantly between day and night.")
} else {
print("Fail to reject the null hypothesis: No significant difference in crime rates between day and night.")
}
Here is the output.
Z-test in Crime Data Analysis (Example: Seasonal Crime Trends)
A Z-test compares proportions between two groups, especially in large datasets where the population standard deviation is known. In our crime dataset, we apply a Z-test to analyze whether crime rates vary significantly between winter and summer in Montreal.
Example Hypothesis:
Does crime occur more frequently in summer than in winter?
- Null Hypothesis (H₀): Crime rates remain the same across winter and summer.
- Alternative Hypothesis (H₁): Crime rates are significantly higher (or lower) in summer compared to winter.
How to Perform a Z-test in Crime Data Analysis
- Extract data for crimes occurring in winter (December, January, February) and summer (June, July, August).
- Calculate the crime proportions for each season.
- Perform a two-proportion Z-test to compare them.
- Interpret the Z-statistic and P-value to determine statistical significance.
Here is the code.
library(dplyr)

df <- read.csv("actes-criminels.csv", stringsAsFactors = FALSE)

df$DATE <- as.Date(df$DATE, format="%Y-%m-%d")

df$MONTH <- format(df$DATE, "%m")

winter_crime <- nrow(df %>% filter(MONTH %in% c("12", "01", "02")))
summer_crime <- nrow(df %>% filter(MONTH %in% c("06", "07", "08")))

total_season <- winter_crime + summer_crime

count <- c(winter_crime, summer_crime)
nobs <- c(total_season, total_season)
z_test_result <- prop.test(count, nobs, correct=FALSE)

print(paste("Z-statistic:", z_test_result$statistic))
print(paste("P-value:", z_test_result$p.value))

alpha <- 0.05

if (z_test_result$p.value < alpha) {
  print("Reject the null hypothesis: Crime rates differ significantly between winter and summer.")
} else {
  print("Fail to reject the null hypothesis: No significant difference in crime rates by season.")
}
Here is the output.
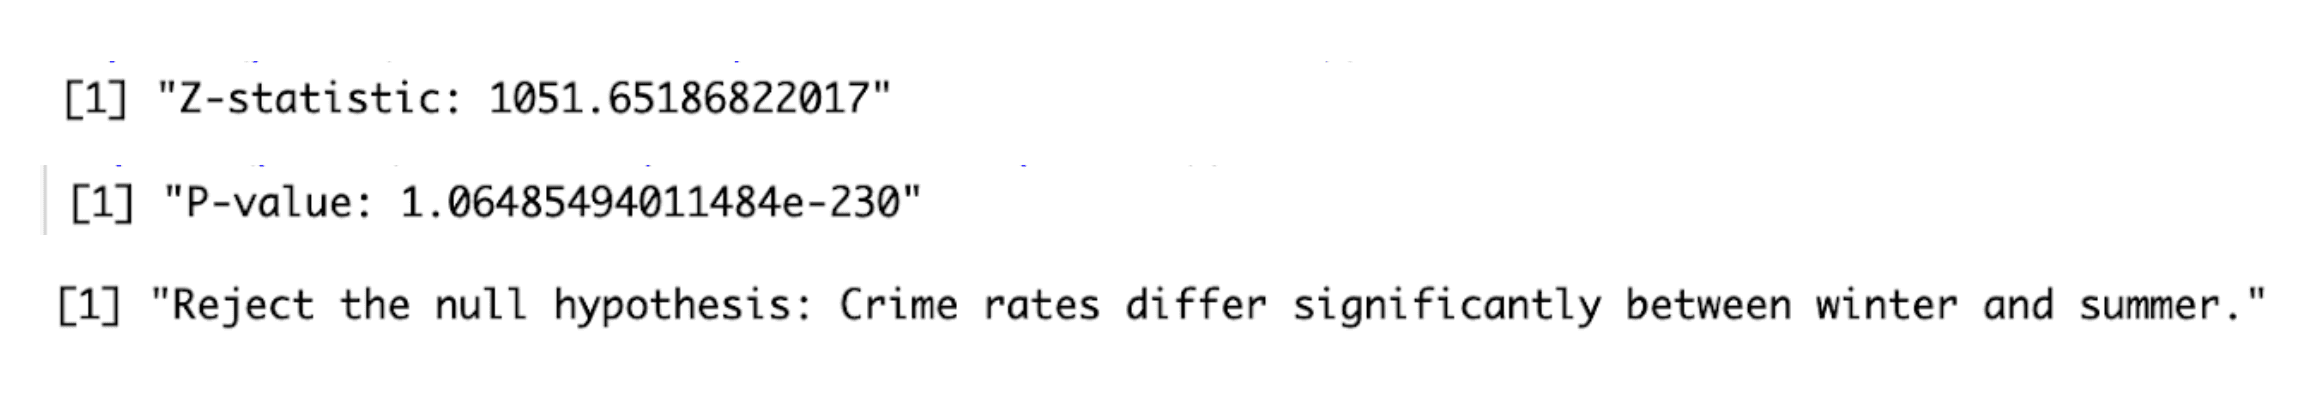
Crime rates in summer are significantly higher than in winter.
Key Differences Between T-test and Z-test
Having seen both tests in action, let's look at when to choose each.
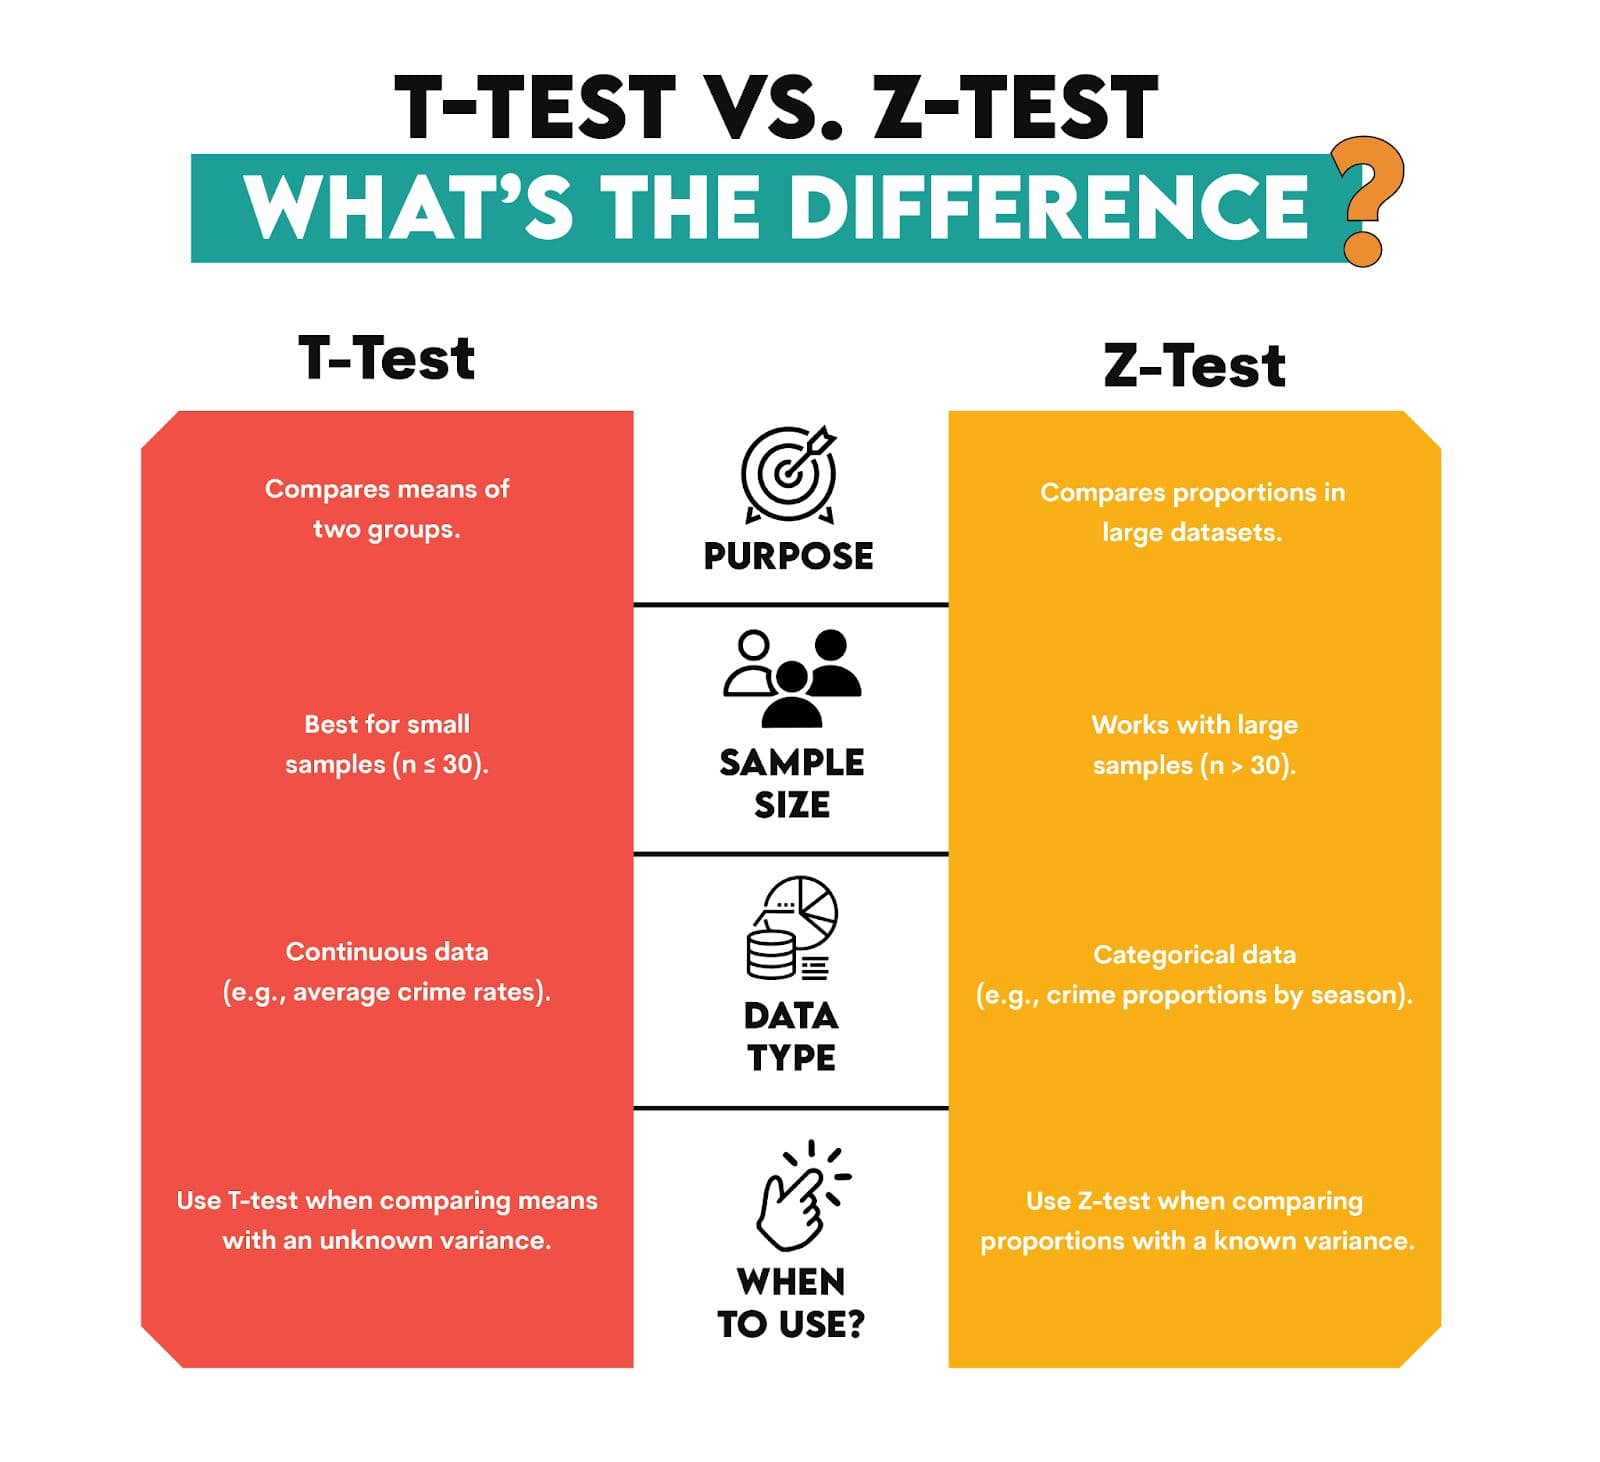
1. Purpose of Each Test
- T-test: A statistical test that compares the means of two groups. Example? Daytime v. nighttime average crime rates
- Z-test: Tests the proportions. To put it differently, a bit like we compare the crime rate of winter with summer.
2. Sample Size Requirements
- T-test: Ideal for smaller (30 or less) samples.
- Z-test: In the case that the population standard deviation is known, we will use it for larger samples (n>30)
Example: T-test would be your choice if you had only 10 weekly crime reports. But thousands and thousands of records? The Z-test provides refined results for you.
3. Type of Data Analyzed
- T-test: Works with continuous data (for instance, average no. of crimes over months)
- Z-test: Categorical Data (e.g., proportion of crimes in different seasons.)
Example: When you want an average response time for police officers, a T-test makes sense. For example: percentage of crimes occurring in summer& winter. This time, you need a Z-test instead.
4. Assumptions
- T-test: This test assumes that the population standard deviation is unknown and that the data is normally distributed. It is best for small sample sizes.
- Z-test: Valid under the known population standard deviation or when n is large enough for the binomial distribution to be close to the normal distribution.
Example: With thousands of cases, the binomial distribution approximates a normal one, so this is a reasonable choice for our seasonal crime Z-test.
5. Real-world Applications
- When comparing two groups based on continuous variables—for example, the average crime rates for different neighborhoods or police response times across various districts—t-tests are the go-to method.
- Z-tests are great for proportions (e.g., crime rates based upon season or robberies per precinct).
T-test vs. Z-test: When to Use Which?
✔ Use T-test: When we compare means from small samples, and the variance of the two samples is unknown.
✔ Use a Z-test: When comparing proportions in a large dataset, where variance is known or can be assumed.
Final Thoughts
When to use a T-test or a Z-test is one of the core fundamental concepts that you should acquire with this article. T-test is ideal for mean comparisons in small samples with unknown population variance but Z-test is ideal for proportion comparisons in large sets with known or approximated variance.
We showed the practical applications of these tests using crime data from Montreal. While a T-test was used to compare the means indicating whether crime rates differ significantly from 1 time of day to another, a Z-test shows that crime rates in summer are considerably higher than in winter. Such insights can be relatively applied to the real world as law enforcement agencies may be able to use this information to plan resource placement according to seasonal trends.
Share