Python Coding Interview Questions

Categories:
 Written by:
Irakli Tchigladze
Python is considered one of the most important skills in data science, so it’s best to practice answering python coding interview questions that might come up.
Python is one of two programming languages every data scientist must know. Businesses across many industries use Python to improve their AI, machine learning, recommendation systems, face and voice recognition, and even data visualization. Employers look for data scientists who can write Python code to implement these and other features.
The language is particularly useful for writing complex algorithms to work with data. Thanks to the simple syntax and readability of Python code, it is easy to share, communicate and collaborate with your team members to improve your algorithms.
Python is considered one of the most important skills in data science, so it’s best to be prepared to answer any coding interview question that might come up.
Understanding Patterns in Python
The language is the most useful for writing algorithms to improve AI. Machine learning algorithms process large volumes of data, so they need to be fast and efficient by design.
Python algorithms can serve different purposes: arithmetic, sorting and searching. For each type, there are techniques you can apply to ensure the speed and efficiency of your code.
Algorithm constructs are basic building blocks of any function written in Python: linear sequence, conditionals, for and while loops. Knowing when and how to use them is essential for writing efficient algorithms in this language.
Once you know the foundations of Python, it’s time to practice relentlessly to know which technique to apply to solve coding challenges during an interview.
In this article, we will go over specific examples of Python interview questions asked during interviews at big tech companies.
Role of Python for Data Science

All data scientists need to know Python to some extent, but some professions require it more than others. Employer’s expectations and the difficulty of questions will depend on the role and seniority of the position you are applying for.
For example, data scientists working in the field of Machine Learning need to have a deep knowledge of Python. It is the primary programming language used for writing algorithms that process massive amounts of data to improve the quality of decisions made by the AI.
If you’re applying for Machine Learning positions, employers may ask multiple difficult questions to determine the depth of your knowledge. On the StrataScratch blog, you can find answers to python coding interview questions of varying difficulty.
If you plan to work in areas of data science where you’ll have to write powerful, yet efficient algorithms, platforms like StrataScratch can help you a lot. Here you can find actual python coding interview questions asked during interviews, as well as explanations and tips to guide you in the right direction.
Framework for Solving Python Coding Data Science Interview Questions
Complex Python coding interview questions can be overwhelming, and often beginners don’t know how to start approaching the challenge. Following these four steps will allow you to methodically solve any Python coding interview question:
1. Digest the question
Any type of coding interview requires concentration. Before starting to write code or formulating your approach, first you must fully digest the question.
Start by understanding different aspects of the question, such as: available data, expected output and important conditions of the question. If any of these components are not specified, the best solution is to directly ask the interviewer. The better you understand all aspects of the question, the easier it will be to find an answer.
2. Analyze data
To solve a coding challenge, you have to write code that takes available data and outputs the desired result. Therefore you need to consider the volume, format, type and other details of the data.
Also think about the logical real-world implications of what the data represents. For example, a distance value can not be negative.
You also need to know whether the data is stored as a list or a table with multiple columns. It would also help you to look at available data to find out if entries in the list or table are unique or if there are duplicates. Without this information, you will struggle to write Python code that is free of errors.
3. Plan your approach
After looking at data, it’s time to plan your approach. At this stage, you don’t need to know all the details of implementation. Just make a list of logical steps to follow with your code to get the final answer.
Write down notes to better focus on the problem and remember all your ideas for getting the answer. You can also write pseudo code to be more specific in how you plan to approach the problem.
4. Write code
First, give your function a descriptive name and define what arguments it’s going to accept.
Start writing code to solve the challenge, even if the answer is inefficient. You may come up with a more efficient approach while you’re coding. If there are multiple ways to approach the problem, decide which one you’re going to use.
If you have to write an algorithm, check if you can implement common techniques: backtracking, breaking down the problem into subproblems, implementing a memory for efficiency, and others.
Go back to the question and read it carefully. Make sure to return the right value.
Python Coding Interview Questions

Let’s look at the actual python coding interview questions.
Python Coding Interview Question #1 - Class Performance
This is an interview question asked by interviewers at cloud-based service provider Box.

Link to the question: https://platform.stratascratch.com/coding/10310-class-performance
Digest the question
This is a fairly simple question, but it requires focus to properly understand what the final output should be. Each row identifies one student and reports their assignment scores.
Pay attention to keywords to get the right answer. We have to calculate the largest difference between all students in the table. We’ll have to find students with the highest and lowest scores, and subtract the lowest from the highest.
If you read the question carefully, you’ll see that we need to output the difference between highest and lowest scoring students in the entire table. The output is going to be one number.
Analyze data
For this python coding interview question, we have only one available table with five columns: id, student, assignment1, assignment2, assignment3. As we already mentioned, each row in the table describes one student.
box_scores
| id: | int64 |
| student: | object |
| assignment1: | int64 |
| assignment2: | int64 |
| assignment3: | int64 |
The id column contains an integer value that is unique and identifies each student. The student column contains their full name, a text value. assignment1, assignment2 and assignment3 columns contain integer values that represent scores students got for each of the three assignments.
box_scores table with actual data:
Plan your approach
- Calculate each student's total score from three assignments.
- Find students with the highest and lowest scores.
- Subtract the lowest score from the highest and output the answer.
Write code
First, we import two libraries: pandas and numpy. These provide essential utilities you need to easily get to the answer.
Step 1 - Calculate each students’ total score
We calculate the total_score value for each student. To do that, we’ll have to add values of assignment1, assignment2, and assignment3 columns.
box_scores['total_score'] = box_scores['assignment1']+box_scores['assignment2']+box_scores['assignment3']Step 2 - Find the highest and lowest scores
We use the max() function to find the student with the highest score. We find the minimum score using the min() function.
box_scores['total_score'].max()
box_scores['total_score'].min()
Step 3 - Calculate the difference
Finally, we subtract the lowest from the highest value to find and output the difference.
box_scores['total_score'].max() - box_scores['total_score'].min()Final code:
import pandas as pd
import numpy as np

box_scores['total_score'] = box_scores['assignment1']+box_scores['assignment2']+box_scores['assignment3']
box_scores['total_score'].max() - box_scores['total_score'].min()
Output

We output one numerical value - the difference between totals of students with the highest and lowest total scores.
Python Coding Interview Question #2 - Expensive Projects
Candidates looking for data science jobs got asked this question at Microsoft.

Link to the question: https://platform.stratascratch.com/coding/10301-expensive-projects
Digest the question
In this python coding interview question, we are given a list of projects with budget information, and a list of employees assigned to each project. We are asked to calculate the number of employees for each project, and the average budget allocated for each employee.
If the division of budget by the number of employees does not return a whole number, you have to round it to the closest number. Candidates are expected to arrange the results from the highest budget per employee to the lowest.
Analyze data
Looking at two tables can help you better understand available data. The ms_projects table contains the information about each project.
ms_projects
| id: | int64 |
| title: | object |
| budget: | int64 |
ms_emp_projects
| emp_id: | int64 |
| project_id: | int64 |
The ms_projects table has three columns: id, title, and budget. The id column contains a numeric value to identify each project. The title column contains a text value. The third budget column contains the number value of the project budget in dollars.
The ms_emp_projects table has two columns: emp_id and project_id. The first column contains an integer that identifies each employee, and the project_id column contains also a numeric identifier for each project.
ms_projects table with actual data:

The second table contains information about employees and their assignments.
ms_emp_projects table table with actual data:

We will use the information contained in both tables to get the number of employees assigned to each project. Then we’ll divide the budget by the number of employees.
Plan your approach
- Get the number of employees assigned to each project
- Divide total budget by the number of employees to get the ratio.
- Round the ratio to the nearest whole number
- Arrange projects and their ratio values in a descending order.
Ideally, we should somehow filter out the projects that do not have employees.
Write code
Once again, we import pandas and numpy libraries, and give them aliases of pd and np.
1. Perform an INNER JOIN
We use the merge() function from the pandas library to perform an INNER JOIN in Python. The first two arguments are the names of two tables, using the how keyword we specify the type of JOIN, and then we specify the columns from two tables that contain matching values.
df=pd.merge(ms_projects, ms_emp_projects, how = 'inner',left_on = ['id'], right_on=['project_id'])2. Get the number of employees assigned to each project
The groupby() function allows us to determine the total number of employees for each project. Then we get the total number of unique projects using the size() function.
df1=df.groupby(['title','budget'])['emp_id'].size().reset_index()3. Divide total budget by the number of employees to get the ratio and round it to the nearest whole number.
We calculate the average budget for each employee by dividing values in the budget column with the number of employees. We use the round() function to round the results to the nearest integer.
df1['budget_emp_ratio'] = (df1['budget']/df1['emp_id']).round(0)4. Arrange projects and their ratio values in a descending order.
df2=df1.sort_values(by='budget_emp_ratio',ascending=False)
result = df2[["title","budget_emp_ratio"]]
We use sort_values() function to arrange rows in a descending order, based on their budget_emp_ratio value.
Then we output title and budget_emp_ratio columns.
Final code
import pandas as pd
import numpy as np

df=pd.merge(ms_projects, ms_emp_projects, how = 'inner',left_on = ['id'], right_on=['project_id'])
df1=df.groupby(['title','budget'])['emp_id'].size().reset_index()
df1['budget_emp_ratio'] = (df1['budget']/df1['emp_id']).round(0)
df2=df1.sort_values(by='budget_emp_ratio',ascending=False)
result = df2[["title","budget_emp_ratio"]]
Output
In the last line of the code, we output the result, which contains two columns - the name of the project and the ratio.
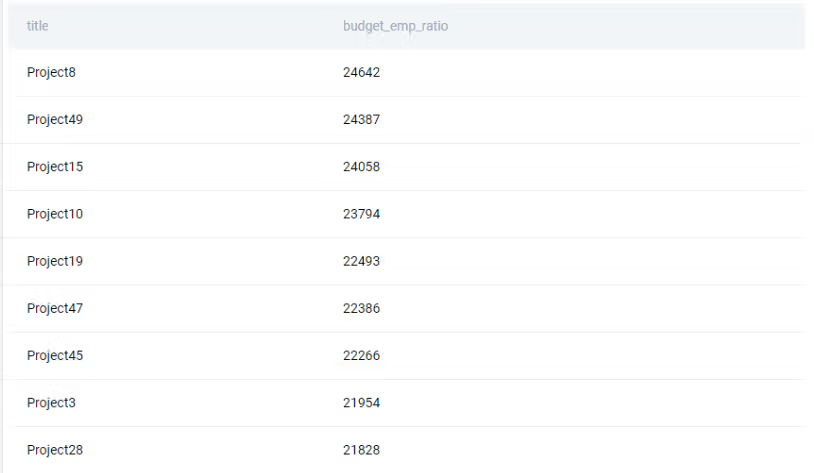
As you can see, the projects with the highest ratios come first, followed by projects with less budget_emp_ratio values.
Python Coding Interview Question #3 - Salaries Differences
Aspiring data scientists have to answer this question to start working at Dropbox.

Link to the question:
https://platform.stratascratch.com/coding/10308-salaries-differences
Digest the question
In this question, we are asked to find the difference between the highest salaries in the marketing and engineering departments. The final output of the function needs to be the absolute difference between the two highest salaries.
We are asked to find the difference, so we have to perform a subtraction operation. If the second salary is higher than the first, the result will be negative. However, the question specifies that we must output a positive (absolute) value, even if the result of subtracting one number from another is negative.
Analyze data
We have two tables - one that contains information about employees and the other about departments. The platform allows you to preview both tables. Let’s take a look:
db_employee
| id: | int64 |
| first_name: | object |
| last_name: | object |
| salary: | int64 |
| department_id: | int64 |
| email: | datetime64[ns] |
In this table, we have six columns: id, first_name, last_name, salary, department_id, email.
The id column contains integer values to identify each employee. first_name and last_name columns contain text that store employees’ first and last names. The salary column stores the dollar amount of an employee's yearly salary. department_id contains integer values to identify the department where employees work. The email column contains values of datetime64 type.
db_employee table with actual data
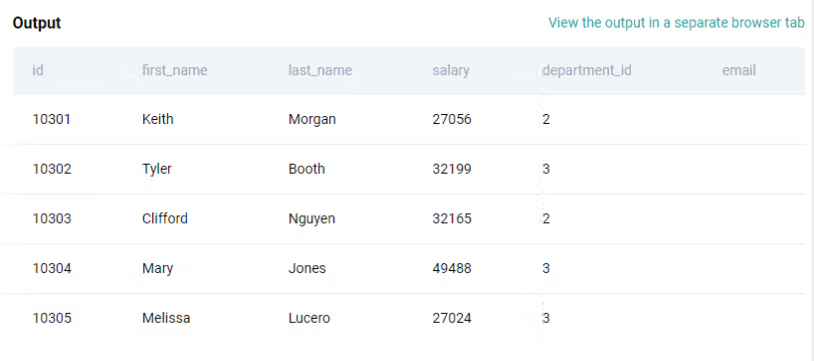
Candidates have to find the difference between the highest salaries in two departments. For this reason, values in two columns - salary and department_id will be particularly important to answer the question.
| id: | int64 |
| department: | object |
In the db_dept table, we have two columns: id and department. The id column contains an integer identifier for each department. The department column contains the textual name of the department.
db_dept table with actual data

The db_employee table only contains the id of the department. We’ll have to look up the department name using the id from the first table.
Plan your approach
- We need to work with data from both tables, so first we must combine them.
- Find maximum salaries for both departments
- Calculate the difference between maximum salaries from two departments.
- Output the difference as an absolute value. Even if the difference between salaries is negative, we have to return it as a positive value.
Write code
As usual, we import pandas and numpy libraries to use utilities like the merge() function.
1. Combine data from two tables
First, we use the merge() function to work with data from two tables. This function is a Python replacement of the JOINs feature from SQL. We specify two tables that need to be combined, how to combine them, and the shared dimension (column) between them.
In this case, we tell Python that the department_id column from the db_employee table and id column from the db_dept table contain values to identify the department.
df = pd.merge(db_employee, db_dept, how = 'left',left_on = ['department_id'], right_on=['id'])2. Find maximum salaries and calculate the difference between them
We create a variable df1 to store the rows where the value of the department column is engineering. We use groupby() and max() functions to find the highest salary for the engineering department and store it in the df_eng variable.df_mkt variable.
We do the same for the marketing department and store the highest salary in the df_mkt variable.
df1=df[df["department"]=='engineering']
df_eng = df1.groupby('department')['salary'].max().reset_index(name='eng_salary')
df2=df[df["department"]=='marketing']
df_mkt = df2.groupby('department')['salary'].max().reset_index(name='mkt_salary')
3. Calculate the difference between maximum salaries from two departments.
Subtract the value of the eng_salary column of the df_eng variable from the mkt_salary column of the df_mkt variable.
df_mkt['mkt_salary'] - df_eng['eng_salary']4. Output the result as an absolute value
Wrap the operation in abs() function to get the absolute value. We give the name salary_difference to the column.
result = abs(pd.DataFrame(df_mkt['mkt_salary'] - df_eng['eng_salary']))
result.columns = ['salary_difference']
Final Code
import pandas as pd
import numpy as np

df = pd.merge(db_employee, db_dept, how = 'left',left_on = ['department_id'], right_on=['id'])
df1=df[df["department"]=='engineering']
df_eng = df1.groupby('department')['salary'].max().reset_index(name='eng_salary')
df2=df[df["department"]=='marketing']
df_mkt = df2.groupby('department')['salary'].max().reset_index(name='mkt_salary')
result = abs(pd.DataFrame(df_mkt['mkt_salary'] - df_eng['eng_salary']))
result.columns = ['salary_difference']
result
Output

We have only one column which contains the answer - the difference between the highest salaries of two departments.
Python Coding Interview Question #4 - Revenue Over Time
In this difficult question from Amazon, candidates have to aggregate individual user purchases to find average revenue of three months.

Link to the question: https://platform.stratascratch.com/coding/10314-revenue-over-time
Digest the question
Before writing any code, it's a good idea to read this python coding interview question multiple times. It contains specific instructions on how to calculate the three month average, as well as how to format and order it. It will also help you handle edge cases, like calculating 3-month rolling average for the first two months.
Analyze data
We have only one table with three columns:
amazon_purchases
| user_id: | int64 |
| created_at: | datetime64[ns] |
| purchase_amt: | int64 |
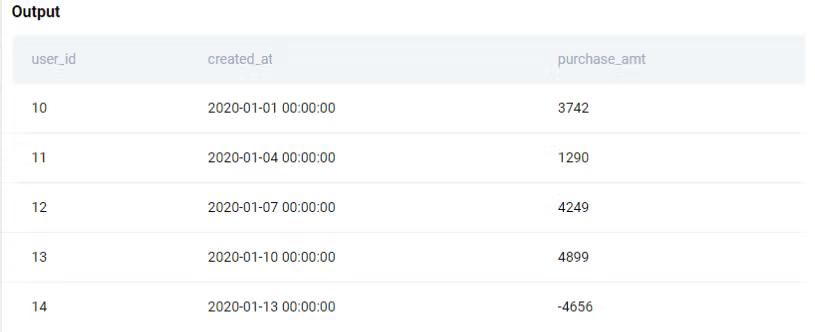
The user_id column contains integer values to identify each user. The created_at column stores datetime64 values. Lastly, the purchase_amt column also contains integers to measure dollar value of the purchase.
amazon_purchases table with actual data:
Plan your approach
- Import the datetime library (also, pandas and numpy libraries) to convert and work with date values.
- Aggregate purchases for each month. Likely will have to use sum() and groupby()
- Calculate the average using mean() and rolling() functions.
- Convert values using the to_records() function to output the result.
Write code
Output
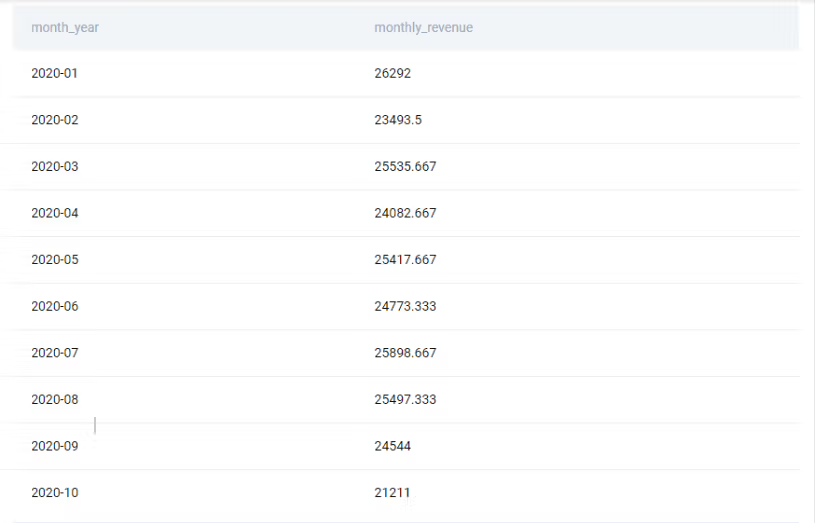
Final output is two columns: month_year and monthly_revenue column, which contains aggregated values.
Python Coding Interview Question #5 - Monthly Percentage Difference
This is a second difficult question from Amazon where candidates have to work with sales data.

Link to the question: https://platform.stratascratch.com/coding/10319-monthly-percentage-difference
Digest the question
Question description contains important details about output values, their format and how records should be ordered. It also contains information on how to calculate monthly percentage change.
Analyze data
We have one table with four columns:
sf_transactions
| id: | int64 |
| created_at: | datetime64[ns] |
| value: | int64 |
| purchase_id: | int64 |
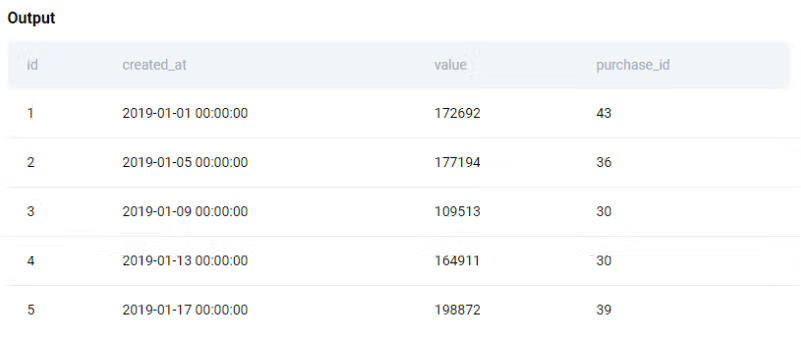
To solve this question, you have one table sf_transactions, where each row describes sales volume for a specified date. The id column contains integer values to identify each transaction. created_at column contains the datetime value of the time when the transaction occurred. value and purchase_id columns both contain integer values.
sf_transactions table with actual data:
Plan your approach
- Import the pandas and numpy libraries to use the apply(), to_period(), to_datetime() functions
- Convert current datetime values to months.
- Sum of all transaction values for each month using sum() and groupby() aggregate functions.
- Use sort_values() function to arrange dates ascendingly, from earlier to later.
- ‘Move down’ values in the monthly aggregate column to create a new prev_value column using the shift() function.
- Calculate the difference between current and previous months and divide it by previous month.
- Get the percentage value by multiplying the result of division by 100 and round it to 2 decimals using the round() function.
- Store the result of this calculation in yet another column, called revenue_diff_pct .
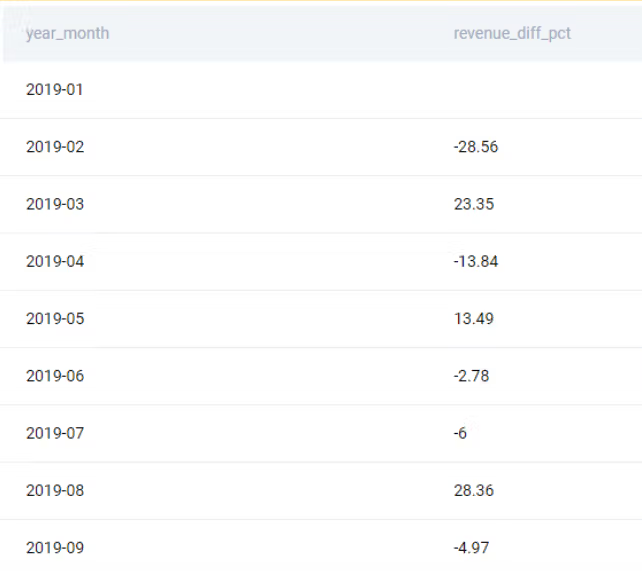
- Output values in the year_month and newly calculated revenue_diff_pct columns.
Write code
Output
Python Coding Interview Question #6 - Finding Updated Records
This is a fairly easy question asked of candidates interviewing for a data scientist position at Microsoft.

Link to the question: https://platform.stratascratch.com/coding/10299-finding-updated-records
Digest the question
Description mentions that the table contains duplicate records. The question tells us to treat the highest salary as the most recent record. Essentially, the task is to output column values for the most recent records, and eliminate duplicates.
Analyze data
We have one table with five columns:
ms_employee_salary
| id: | int64 |
| first_name: | object |
| last_name: | object |
| salary: | int64 |
| department_id: | int64 |
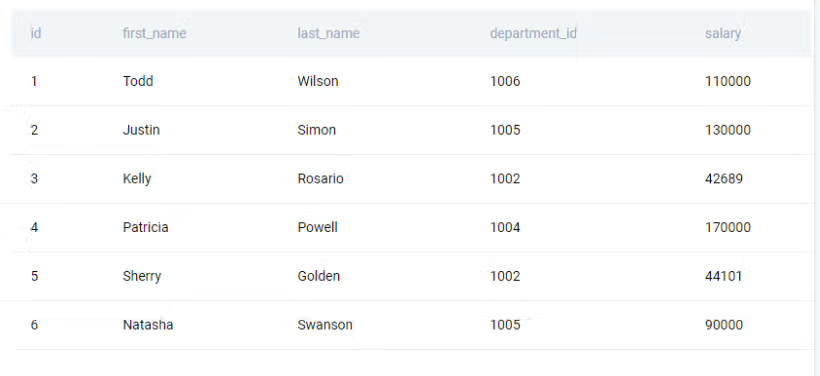
It contains information about employees and their salaries. Values in the id column identify employees, first_name and last_name columns contain text values, salary contains integers that measure annual income. Finally, integers in the department_id column specify the department where the employee works.
ms_employee_salary table with actual data:

Plan your approach
- Import pandas and numpy libraries to use the max() and groupby() aggregate functions.
- Find the highest salary for each department using the max() function.
- Use the sort_values() function to arrange records ascendingly.
Write code
Output
Python Coding Interview Question #7 - Total Number of Housing Units
This question comes from the vacation rental platform, Airbnb.

Link to the question: https://platform.stratascratch.com/coding/10167-total-number-of-housing-units
Digest the question
To solve this question, the task is fairly simple: calculate the total number of housing units completed in each year. Order years chronologically, from early to later.
Analyze data
Quick intro
housing_units_completed_us
| year: | int64 |
| month: | int64 |
| south: | float64 |
| west: | float64 |
| midwest: | float64 |
| northeast: | float64 |
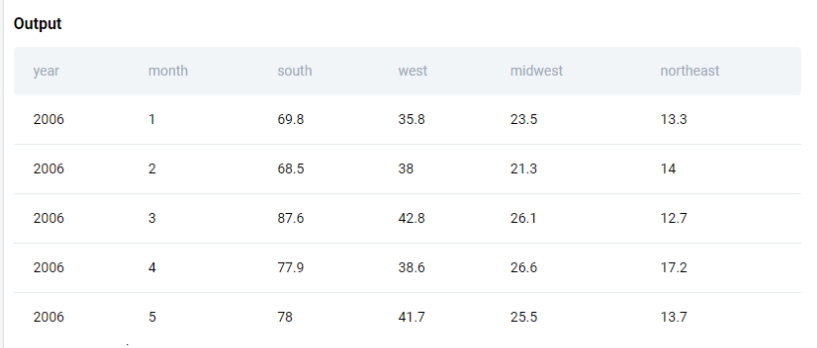
Candidates are given a table with six columns. The first two columns contain an integer of year and month when the buildings were built. The next four columns contain a float value of completed units for sub-region of the US: south, west, midwest, northeast.
housing_units_completed_us table with actual data:
Plan your approach
- Use sum() and groupby() aggregate functions to get the total number of buildings built each year
- Output the year and total number of buildings built in that year.
Write code
Output

Python Coding Interview Question #8 - Rank Guests Based on Their Ages
Another, slightly more difficult question from Airbnb.

Link to the question: https://platform.stratascratch.com/coding/10160-rank-guests-based-on-their-ages
Digest the question
For this question, you have to rank guests based on the number value in their age column and order the output in descending order. The older guests come first, the younger ones will come later.
Analyze data
To solve this python coding interview question, we have to work with one table with four columns.
airbnb_guests
| guest_id: | int64 |
| nationality: | object |
| gender: | object |
| age: | int64 |
The guest_id column contains a unique number to identify each guest. The nationality column contains the text value, like ‘China’. The gender column also contains a piece of text, ‘M’ for male and ‘F’ for female. Finally, the age column also contains a number value.
ms_emp_projects table table with actual data
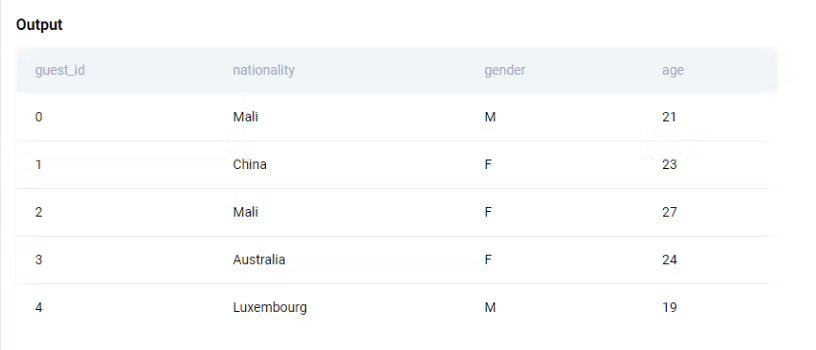
For this question, we need to rank rows based on numerical values in the age column.
Plan your approach
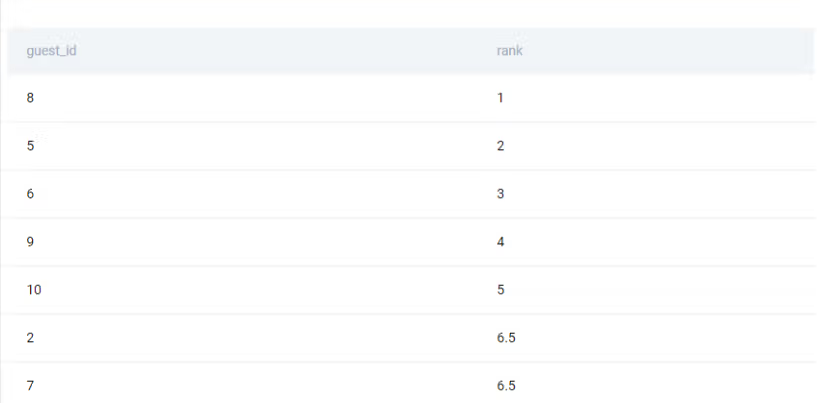
- Use the rank() function to create a new column rank, which will contain each guest’s rank depending on their age.
- Use the sort_values() function to arrange rows in a descending order, depending on values in the rank column.
- Output values in guest_id and rank columns.
Write code
Output
Python Coding Interview Question #9 - Find the Number of Yelp Businesses That Sell Pizza
A question where potential employees have to aggregate data of Yelp businesses.

Link to the question: https://platform.stratascratch.com/coding/10153-find-the-number-of-yelp-businesses-that-sell-pizza
Digest the question
To solve this question, candidates have to identify the businesses that sell pizza, count the number of such instances and output it.
Analyze data
To answer this python coding interview question, you’ll have to work with one yelp_business table, which contains detailed information about businesses on the platform.
yelp_business
| business_id: | object |
| name: | object |
| neighborhood: | object |
| address: | object |
| city: | object |
| state: | object |
| postal_code: | object |
| latitude: | float64 |
| longitude: | float64 |
| stars: | float64 |
| review_count: | int64 |
| is_open: | int64 |
| categories: | object |
There are many columns. categories is particularly important, because when a business sells Pizza, this column will contain a string ‘Pizza’.
ms_emp_projects table table with actual data:

Plan your approach
- Use the str.contains() function to filter businesses based on the value in categories column.
- Find and output the length of the filtered list using the len() function.
Write code
Output

Python Coding Interview Question #10 - Find the Number of Customers Without an Order
Finally, we will go over the answer to this ‘Medium’ difficulty question from Amazon.

Link to the question: https://platform.stratascratch.com/coding/10089-find-the-number-of-customers-without-an-order
Digest the question
The conditions for this python coding interview question are fairly clear. It asks us to find customers without orders, so likely we will have to check if customer ids appear in the orders table.
Analyze data
We need to work with two tables - orders and customers to get the answer.
orders
| id: | int64 |
| cust_id: | int64 |
| order_date: | datetime64[ns] |
| order_details: | object |
| total_order_cost: | int64 |
customers
| id: | int64 |
| first_name: | object |
| last_name: | object |
| city: | object |
| address: | object |
| phone_number: | object |
The orders table contains five columns. The customers table has six columns. The most important columns are cust_id from the orders table and id column from the customers table. We will have to check if values in the id column match with the cust_id column.
orders table with actual data:

customers table with actual data:

Plan your approach
- In Python, we will have to import the pandas library to use the merge() function as a replacement of SQL JOINs.
- Specify two tables, the shared dimension and conditions for merging data.
- Find and get the number of instances where customers did not place an order. Use the isnull() function.
- Output the number of customers without orders
Write Code
Output

Conclusion
Employers regard Python as one of the most important programming languages for data scientists. So it pays off to be prepared for any Python questions that might come up during an interview.
In this article, we listed ten Python coding interview questions of different types and difficulty. The best way to practice answering Python coding interview questions is to write solutions yourself. StrataScratch platform offers this and many other features to help you improve your coding skills in a safe learning environment.
Share


