Postgres Aggregate Functions You Must Know

Categories:
 Written by:
Irakli Tchigladze
In this article, we’ll explain the most popular Postgres aggregate functions, discuss their use cases, and answer five interview questions by top employers.
Some of the most important business decisions made today are backed up by data. Companies collect and store detailed information about their users, products, and other important elements of their business.
Raw data is only useful if there are professionals who can analyze and gain insights from it. That’s why companies are looking for data scientists with extensive skill sets to help them make important data-driven decisions.
In this article, we will discuss PostgreSQL aggregate functions, a small, but important subset of skills that every data scientist must have.
Interviews often involve challenges, so being able to write queries using PostgreSQL can significantly improve your chances of landing a job. Data scientists who already have a job reach new career heights by learning Postgres.
What are Postgres Aggregate Functions?
Aggregate functions in PostgreSQL provide different ways to summarize large volumes of data. These functions are frequently used for their wide-ranging use cases. They work similarly to aggregate functions in MySQL. If you’d like to learn about the differences between two types of databases, Postgres vs MySQL on StrataScratch blog.
Aggregate functions can be used to aggregate data in the entire table or separate rows into groups and summarize data for each group. For instance, if we have sales data, we can find the total value of all sales or calculate the total sales for each user.
An important feature of aggregate functions is that the summarized result is collapsed into one row. For example, if you use the SUM() to find a total of values in a certain column, aggregate functions return a single row with the calculated total.
For more information and specific examples of aggregate functions, read the StrataScratch blog post about SQL Aggregate Functions.
List of Postgres aggregate functions
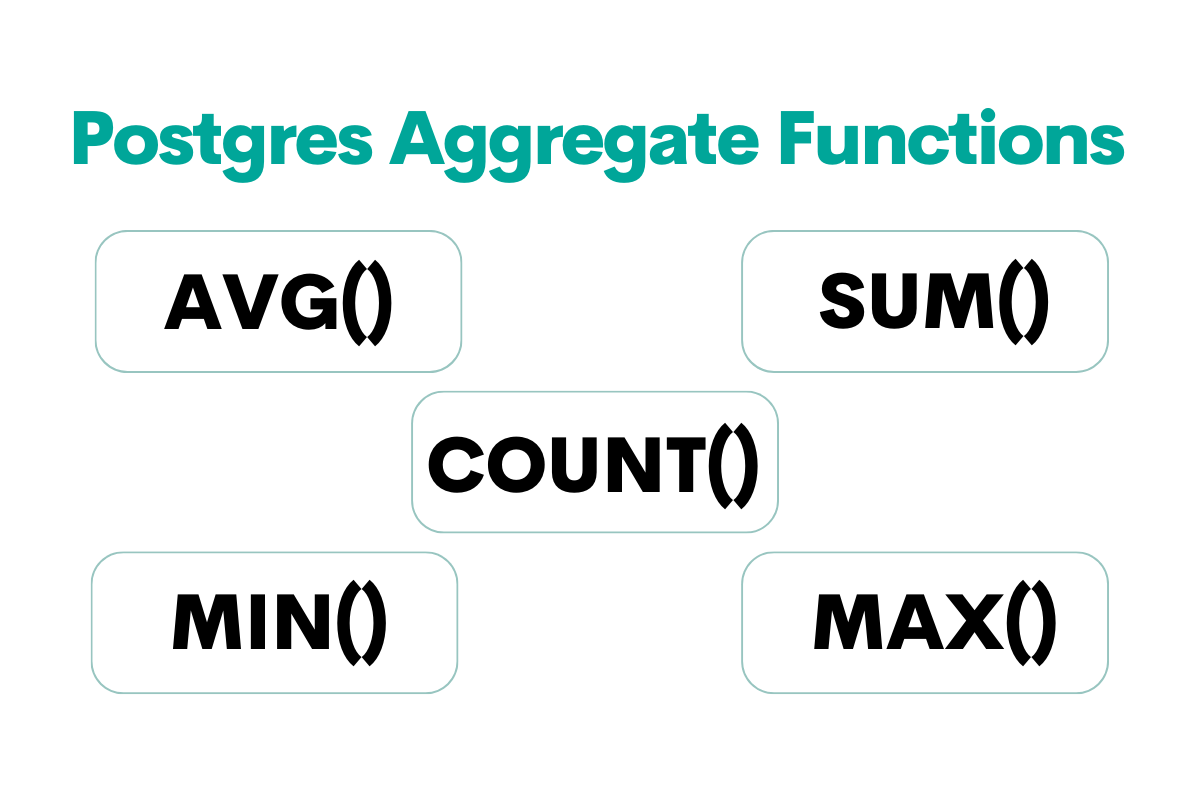
1. COUNT() calculates the number of values in a column or the number of values in each group.
The function will have different results depending on which syntax you use. Asterisk as an argument - COUNT(*) will find the number of all values in the table, including NULL and duplicate values. COUNT(column) will find the number of values excluding NULL.
COUNT(DISTINCT column) filters out NULL as well as any duplicate values in the column and returns the number of unique values.
2. SUM() adds up the total of all values in a certain column. It is typically applied to columns with numeric values. When used with a GROUP BY statement, it adds up the total for each group. It ignores NULL values.
By default, the SUM() aggregate function calculates the total of all values, including duplicates. You can use the DISTINCT clause to make sure it adds up only unique values.
3. MAX() finds the highest value in the specified column. When used with a GROUP BY statement, the aggregate function will find the highest value in each group.
4. MIN() finds the lowest value in the specified column. When used with a GROUP BY statement, it will return the lowest value in each group. MIN() function never returns NULL.
5. AVG() function aggregates the average of all values in one column or all values in a group. This aggregate function can only be applied to columns with numeric values. When calculating an average, it simply ignores NULL values.
Using the DISTINCT clause will ensure that AVG() only calculates the average of unique values.
This is just a short list of the most commonly used aggregate functions in Postgres. There are other functions for more advanced use cases. For example, PostgreSQL also provides aggregate functions for statistics, which you can use to make predictions and infer conclusions.
Another category is ordered-set aggregate functions, like mode(), which returns the most common value in a column or a group. Refer to the documentation for a full list of advanced Postgres aggregate functions.
PostgreSQL aggregate functions - practical examples
Let’s imagine you have a products database table where each row describes one product.
You could use COUNT() to get the total number of products.
SUM() to calculate the total value of your stock (if there’s a column to specify the value of each product).
MAX() to find the most expensive product, or MIN() to find the cheapest one.
AVG() to get the average price of products.
Postgres Aggregate Functions with other SQL statements
Aggregate functions with WHERE clause
The WHERE clause is normally used to set a condition to determine which rows are selected. You can use aggregate functions like AVG() to set the condition.
For example, the following query will only select rows where values in the cost column are higher than the average.
SELECT * FROM table WHERE cost > SELECT (avg(cost) from table)You can similarly use the MIN and MAX() aggregate functions to set a condition and SELECT rows that satisfy the criteria.
This query will return the record (or multiple records) that has the lowest value in the cost column.
SELECT * FROM table WHERE cost = SELECT (min(cost) from table)If we use MAX() aggregate function, the query will return row(s) with the highest value in the cost column:
SELECT * FROM table WHERE cost = SELECT (max(cost) from table)
If you want aggregate functions to only be applied to unique values, use the DISTINCT clause. Like so:
SELECT * FROM table WHERE cost = SELECT (max(DISTINCT cost) from table)Aggregate functions with GROUP BY statement
As you probably know, the GROUP BY statement creates groups of rows for each unique value in the column.
Let’s imagine you have data of transactions in an e-commerce store. The GROUP BY statement allows you to separate rows based on who placed the order.
SUM() calculates the total of values (usually numbers) in each group.
For example, the following query will add up values in the cost column for each group of transactions.
SELECT user_id,
       SUM(cost)
FROM transactions
GROUP BY user_id
Transaction records are grouped based on the identity of the user who made them.
Aggregate functions with HAVING clause
The HAVING clause allows you to set a condition to filter groups. It is different from the WHERE clause, which filters every individual row.
WHERE filters records before they are grouped or aggregated. The HAVING clause filters groups whose values are already aggregated.
Just like the WHERE clause, you can use aggregate functions to set a condition for a HAVING clause as well.
For example, use the COUNT() function to only keep groups with more than 5 rows.
SELECT *
FROM transactions
GROUP BY user_id
HAVING count(*) > 5
In this case, count(*) will find the number of rows for each group. The HAVING clause will only return groups with more than five rows.
You can use SUM() to filter groups depending on each group’s total:
SELECT cost
FROM transactions
GROUP BY user_id
HAVING sum(cost) > 100
Or use the MAX() aggregate function to filter groups by setting the maximum value of a certain column:
SELECT cost
FROM transactions
GROUP BY user_id
HAVING max(cost) < 100
MIN() aggregate function allows you to do the opposite, set the minimum limit for each group’s values:
SELECT cost
FROM transactions
GROUP BY user_id
HAVING min(cost) > 20
5 Interview questions on Postgres Aggregate Functions

Let’s explore actual interview questions where you need to use aggregate functions to find the answer.
AVG() Question: Cities With The Most Expensive Homes
In this interview question, candidates have to work with data of home listings on the Zillow marketplace. It is marked as ‘Medium’ difficulty.
Last Updated: December 2020
Write a query that identifies cities with higher than average home prices when compared to the national average. Output the city names.
Table
Link to the question: https://platform.stratascratch.com/coding/10315-cities-with-the-most-expensive-homes
Understand the Question
Candidates are asked to find and compare the average price of homes in each city and the entire country. The task is to determine cities where the cost of properties tends to be higher than the national average.
We’re going to use the AVG() aggregate function to find averages for each city and the entire country. We will have to somehow set a condition and only return values that satisfy it.
Analyze data
Looking at available data can help you wrap your head around the question and plan your logical approach.
All the information you need to answer this question is contained within one zillow_transactions table with five columns:

- The id column contains a number to identify each listing.
- The state and city columns store information about property location.
- The street_address column is a more specific indicator of property location.
- Because the question tells us to calculate average prices, it’s safe to assume that we’ll be working with the mkt_price column, which contains numerical values that stand for home prices in dollars.
StrataScratch also allows you to preview actual tables filled with data.
zillow_transactions table
As we predicted, mkt_price contains numerical values that stand for the price of the home in dollars.
In the preview, we only see records of listings with a city value of ‘New York City’. It’s safe to assume that the table lists homes from other cities as well.
State, listing id, and specific address values are not important for solving this question.
Plan your approach
To answer this question, we have to calculate average home prices for each city and the average price of homes in all cities in the US.
We are going to work with values in the city and mkt_price columns.
We need to separate rows into groups to calculate the average price of homes in each city using the AVG() aggregate function.
To calculate the national average, we simply pass the entire mkt_price column as an argument to the AVG() aggregate function.
Finally, we will set a condition to return cities with higher than the national average.
Write Code
Now, let’s write code to follow our plan.
Step 1: Get the list of all cities
Let’s use a simple SELECT * FROM statement to retrieve the list of all cities in the table.
SELECT city
FROM zillow_transactions a
We also give the table zillow_transactions a shorthand name of a so that we can easily reference it later.
Step 2: Group rows
We use the GROUP BY statement to create a group of rows, one for each city.
SELECT city
FROM zillow_transactions a
GROUP BY city
Step 3: Set up a condition
Next, we need to use the HAVING clause to filter groups (cities) based on a condition.
SELECT city
FROM zillow_transactions a
GROUP BY city
HAVING avg(a.mkt_price) >
  (SELECT avg(mkt_price)
   FROM zillow_transactions)
We use the AVG() aggregate function two times.
Once to calculate the average mkt_price value for each city.
avg(a.mkt_price)This function will find the average price of homes in each city.
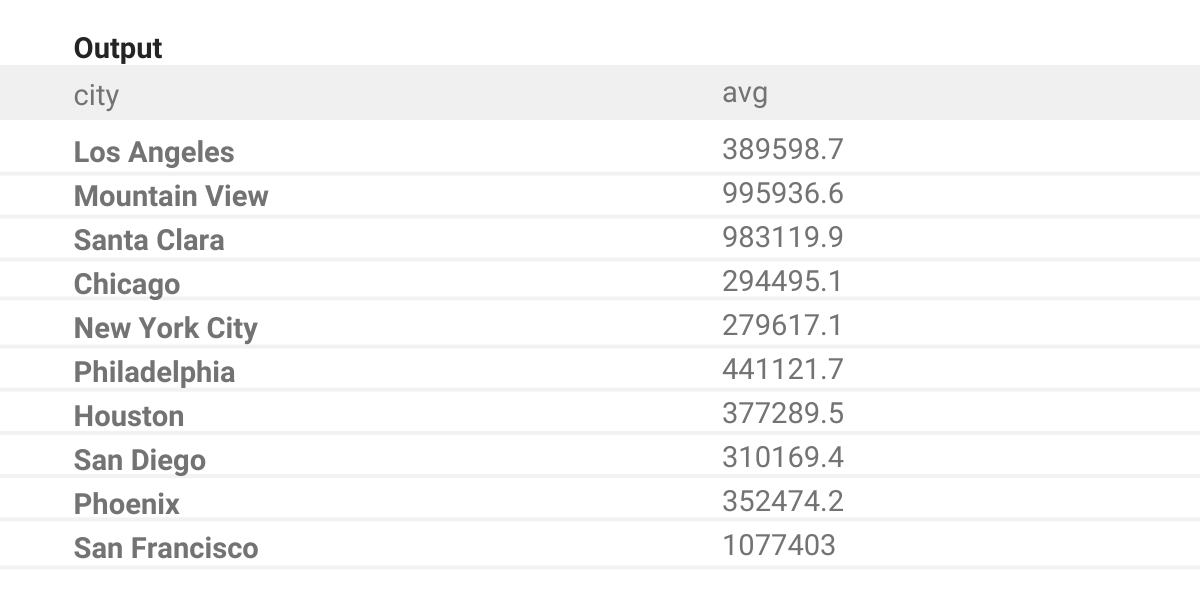
Next, we find the average price of all homes in the US.
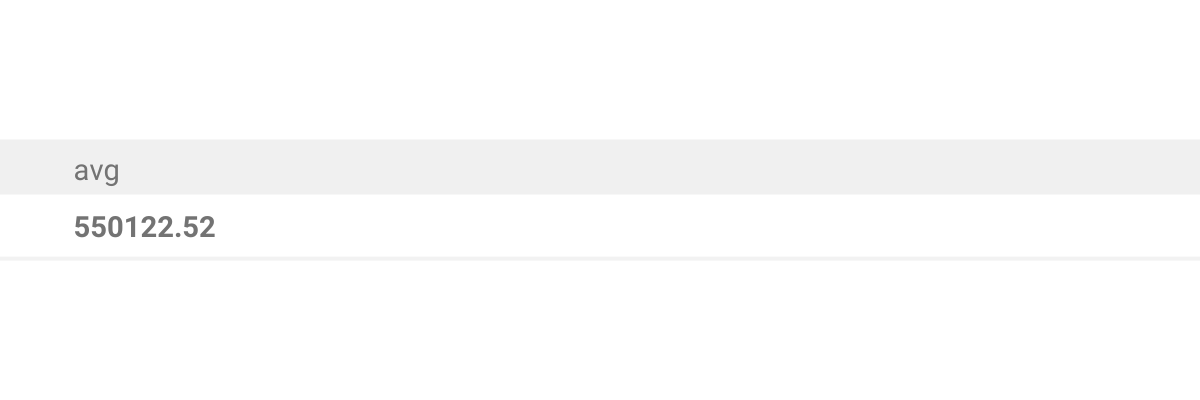
Finally, we compare two averages and use the HAVING clause to only keep cities where the average is higher than the national average.
HAVING avg(a.mkt_price) >
  (SELECT avg(mkt_price)
   FROM zillow_transactions)
Step 4 (Optional) : Order cities
It’s a good idea to arrange city names in an ascending alphabetical order.
SELECT city
FROM zillow_transactions a
GROUP BY city
HAVING avg(a.mkt_price) >
  (SELECT avg(mkt_price)
   FROM zillow_transactions)
ORDER BY city ASC
Output
Running the code will output a list of three cities where the average price of homes is higher than the national average.
MAX() Question: Salaries Differences
In this question, data scientists have to find the difference between the highest salaries of two departments.
Last Updated: November 2020
Calculates the difference between the highest salaries in the marketing and engineering departments. Output just the absolute difference in salaries.
Tables
Link to the question: https://platform.stratascratch.com/coding/10308-salaries-differences
Understand the Question
To answer this question, we have to find a difference. In other words, subtract one value from another. The first value will be the highest salary for the marketing department and the other for the engineering department.
The easiest way to find the highest of values in a certain column is to use the MAX() aggregate function in PostgreSQL.
Analyze data
Before attempting to answer the question, let’s look at two tables that contain necessary information.

In the db_employee table, we have five columns that store information about each employee.
- The id column contains integer values to identify employees.
- The first_name and last_name columns contain text values - employees’ first and last names.
- The salary column contains an integer that stands for employee salary in dollars.
- Values in the department_id column specify the department the employee belongs to.

In the db_dept table, we have two columns:
- id number that identifies each department
- the department column, a written name of the department (like ‘Marketing’).
Let’s look at both of these tables to better understand the columns and values in them.
db_employee table:
It looks like our every assumption about available data was correct.
Numbers in the id column uniquely identify employees. The first_name and last_name columns identify them by their names.
The salary column contains their salary in dollars, and department_id values denote which department they belong to.
db_dept table:
Our assumptions are once again correct. Numbers in the id column uniquely identify the department, whereas the department column contains the textual name of the department.
Plan your approach
The information necessary to answer this question is split between two tables. Therefore we’ll have to JOIN them on a shared dimension.
Since records in the db_employee table reference department id values and not department names, the shared dimension is clearly department id.
Once we combine the two tables, we need to find the highest salary in each department. We can use the WHERE clause to only keep employees with marketing value in the department column. And apply the MAX() aggregate function in Postgres. Then we do the same for the other department.
Once we find the highest salary values for the two departments, we need to subtract them.
The question tells us to output the absolute difference between the two, so the subtraction operation needs to be wrapped with the ABS() function.
Once you calculate the difference, It’s also a good idea to give the end result a descriptive name using the AS keyword.
Write the code
Step 1: Find the highest values of the engineering department
Write a query to find the highest salary of the marketing and engineering departments.
You can use the WHERE clause to specify the department value.
SELECT max(salary)
FROM db_employee emp
JOIN db_dept dept ON emp.department_id = dept.id
WHERE department = 'engineering'
We also need to combine two tables into one based on department id value.
This query will return the highest salary for ‘engineering’ department:

Step 2: Find highest salary of marketing department
This step is going to be very similar to the previous one. Except this time, we need to find the highest salary of ‘Marketing’ department.
SELECT max(salary)
FROM db_employee emp
JOIN db_dept dept ON emp.department_id = dept.id
WHERE department = 'marketing'
Running this query will have the following output:

Step 3: Find the absolute difference between highest salaries of two departments
Finally, we need to subtract one salary from another to find the difference between them.
Logically, the difference between salaries should not be negative. The question explicitly asks us to find the absolute difference. So we should wrap the subtraction operation with ABS() function.
SELECT
  ABS((SELECT max(salary)
   FROM db_employee emp
   JOIN db_dept dept ON emp.department_id = dept.id
   WHERE department = 'marketing') -
  (SELECT max(salary)
   FROM db_employee emp
   JOIN db_dept dept ON emp.department_id = dept.id
   WHERE department = 'engineering')) AS salary_difference
Lastly, we can use the AS command to give the result column a readable name.
Output
Running the query should output the result of the subtraction.
COUNT() Question: Number Of Custom Email Labels
To answer this question, you’ll have to find the number of emails with a custom label.
Find the number of occurrences of custom email labels for each user receiving an email. Output the receiver user id, label, and the corresponding number of occurrences.
Tables
Link to the question: https://platform.stratascratch.com/coding/10120-number-of-custom-mail-labels
Understand the question
The main difficulty with this question is that the description does not clearly define what is a custom label. Hopefully looking at data will point us in the right direction. Alternatively, you can get direction from the interviewer.
To solve this challenge, we need to combine data from two tables.
The question description also specifies that we need to output id of the user receiving the email, custom label, and the number of custom labels.
Analyze data
Let’s look at two tables that contain available data for this question.
The google_gmail_emails table contains information about mails sent via Gmail.

- The id column stores integer values to identify each email sent via Gmail.
- from_user and to_user columns probably specify users sending and receiving the email.
- Numbers in the day column specify the day when the email was sent.
Next, let’s look at the google_gmail_labels table:

- Numbers (integers) in the email_id column identify each email
- The label column contains email labels.
Let’s look at actual tables to better understand the relationship between two tables:
google_gmail_emails table:
We correctly assumed that the id identifies each email sent through the platform. from_user and to_user specify users sending and receiving the email. day is a numeric value, which most likely indicates the day in the week when the email was sent.
google_gmail_labels
Once we look at values in the label columns, it becomes clear that we have to find instances that contain ‘Custom’ text. In this case, emails with the id of 1 and 7 would have custom labels.
Plan your approach
To find the answer and output the necessary values; we need to combine data from two tables. For that, you need to notice that the id column from the main table and email_id from the labels table contain the same values.
We will need to use the INNER JOIN because it only keeps rows with common values in the shared dimension. We can use the ON statement to chain additional conditions so that we only keep rows where the label column contains the ‘Custom’ text.
Next, we use the GROUP BY statement to create a group of email labels based on the identity of receiving users. Then we use the COUNT() Postgres aggregate function to find the number of labels in each group.
Write the code
Step 1: Combine data from two tables
We need to use the INNER JOIN, which will only leave records where there’s information about exchanged emails as well as their labels.
SELECT *
FROM google_gmail_emails e
INNER JOIN google_gmail_labels l ON e.id = l.email_id
We give the emails table the shorthand name of e, and the labels table the name of l.
Then we use the ON condition to specify the shared dimension - email id.
Step 2: Keep rows with a label that contains ‘Custom’ text
We can use AND logical operator to chain one more condition - the label column must match the pattern of custom labels.
SELECT to_user AS user_id,
       label,
FROM google_gmail_emails e
INNER JOIN google_gmail_labels l ON e.id = l.email_id
AND l.label ILIKE 'custom%'
Since the question asks us to output these values, we also select senders’ id values, email labels.
Step 3: Find the number of unique labels for each user
We need to group rows for each unique pair of user id and label and count the number of rows in each group.
SELECT to_user AS user_id,
       label,
       COUNT(*) AS n_occurences
FROM google_gmail_emails e
INNER JOIN google_gmail_labels l ON e.id = l.email_id
AND l.label ILIKE 'custom%'
GROUP BY to_user,
         label
Output
According to the question description, running the final query needs to return the id of the user who receives the email, the label and the number of times that user has received an email with a custom label.
SUM() Question: Total Number Of Housing Units
This question was asked during an interview at Airbnb. It’s easy as long as you thoroughly understand aggregate functions in PostgreSQL.
Find the total number of housing units completed for each year. Output the year along with the total number of housings. Order the result by year in ascending order.
Note: Number of housing units in thousands.
Table
Link to the question: https://platform.stratascratch.com/coding/10167-total-number-of-housing-units
Understand the question
In this question, we have a table that contains information about the number of housing units completed in a specified time period. We need to calculate the total of housing units built each year.
The question description clearly states that the answer should consist of two columns: years and the number of housing units completed in that year.
Analyze data
Look at available data to plan your approach.
All the information you need to answer the question is stored in one table:

- The year column stores integer values indicating the year when houses were constructed.
- The month column stores integer values indicating the month of the year when housing units were completed. year and month columns together specify the time period when the units were completed.
- south, west, midwest, northeast columns contain float values (decimal numbers), which are the number of houses completed in each region for the specified time period.
Let’s preview the table to better understand the data:
We correctly assumed that year and month columns specify the time when houses were built. The other four columns contain decimal numbers, which stand for completed units (in thousands) for each region.
Plan your approach
Writing a query becomes easier once you study the question description and available data.
To answer this question, we need to separate records into groups based on year values. Then use the SUM() aggregate function to find the total housing units for each year.
In PostgreSQL, expressions are valid arguments for the SUM() aggregate function. You can aggregate the sum of four columns by adding four columns in the argument of the function.
The question also tells us to output years and aggregated housing units. We also have to arrange them in ascending order.
Write the code
Step 1: Create a group of rows for each year
We use the GROUP BY statement to group rows for each year.
SELECT YEAR
FROM housing_units_completed_us
GROUP BY 1
Step 2: Find the total number of housing units
When applied to groups, the SUM() aggregate function will add up values in a specified column.
In this case, we need to find a total of four columns.
SELECT YEAR,
       SUM(south + west + midwest + northeast) AS n_units
FROM housing_units_completed_us
GROUP BY 1
Step 3: Order rows in an ascending chronological order
Finally, we need to order rows ascendingly based on year values.
SELECT YEAR,
       SUM(south + west + midwest + northeast) AS n_units
FROM housing_units_completed_us
GROUP BY 1
ORDER BY 1
Output
The final answer should show years in ascending order (from earlier to later) and the corresponding total number of units.
MIN() Question: Employee With Lowest Pay
Candidates aspiring to work for the City of San Francisco have to analyze data on public workers and their salaries.
Find the employee who earned the lowest total payment with benefits from a list of employees who earned more from other payments compared to their base pay. Output the first name of the employee along with the corresponding total payment with benefits.
Table
Link to the question: https://platform.stratascratch.com/coding/9980-employee-with-lowest-pay
Understand the question
To solve this challenge, we need to find a person who earned (including benefits) the least of all people whose ‘other payments’ are higher than their base pay.
It’s not exactly clear what ‘other payments’ means. Hopefully, looking at data should help us understand.
The question also tells us to output the person’s name as well as their total earnings.
Analyze data
To solve this question, we have detailed records of public workers’ jobs and their salaries.
There is just one table, sf_public_salaries. Let’s look at columns and the types of values in them.

There are many columns here, so let’s just discuss the ones that are going to be important.
- We will probably need values in the basepay and otherpay columns to set up a condition (workers must have a higher otherpay value)
- We have two columns totalpay and totalpaybenefits. Once the candidates are filtered, we need to find those with the lowest total pay including benefits. Most likely, these values will be stored in the totalpaybenefits column.
- The question also tells us to output the first name of the employee. It is most likely stored in the employeename column.
Next, let’s look at the actual data in the table:
Looking at this data, we can confirm that the totalpaybenefits column includes base pay and benefits combined.
An interesting detail is that the employeename column contains a full name, not just the first name.
Plan your approach
There are multiple ways to approach this question. The easiest is to create a CTE that returns rows that meet the condition - values in the otherpay column should be higher than basepay.
Next, we can use another WHERE clause to select the row from the CTE that has the lowest totalpaybenefits value.
We will also have to extract first name values from full names in the employeename column.
Write the code
Step 1: Get the list of employees who satisfy the criteria
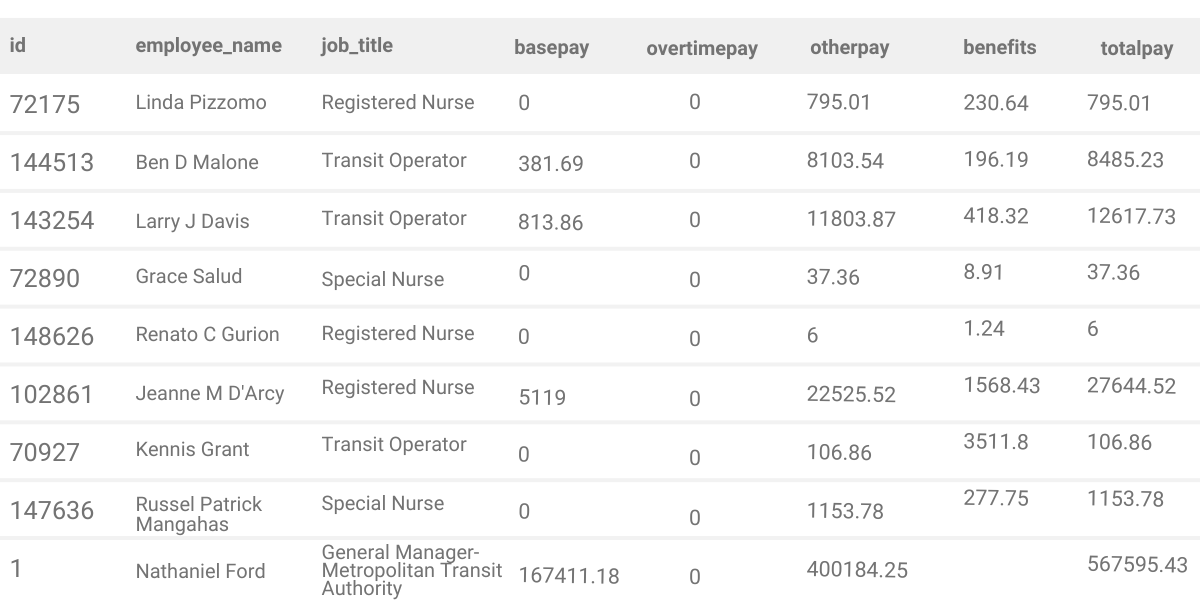
To find the answer, we must filter records based on one condition - numbers in the otherpay column are higher than those in the basepay column.
We create a query that returns filtered results. We will use the WHERE statement to set the condition.
SELECT *
FROM sf_public_salaries
WHERE otherpay > basepay
This query will return rows where the otherpay values are higher than basepay.
Step 2: Find employee with the lowest pay, including benefits
In this question, we are only concerned with employees whose otherpay is higher than basepay. Once we have those records captured, we can use the WITH and AS keywords to create and reference the CTE later on. We name it tpb.
Next, we use the additional WHERE clause to select rows from the CTE that have the lowest totalpaybenefits value.
WITH tpb AS
  (SELECT *
   FROM sf_public_salaries
   WHERE otherpay > basepay)
SELECT *
FROM tpb
WHERE totalpaybenefits =
    (SELECT min(totalpaybenefits)
     FROM tpb)
This will return the row with the lowest totalpaybenefits value.

Step 3: Select specific columns
In step 2, we return the entire row filled with details of the employee with the lowest salary.
The question asks us to output only the first name of the lowest paid person and their corresponding salary.
To get the first name, we’ll have to use the SPLIT_PART() function. Looking at available data, we can see that first names are at the start of values in the column. The SPLIT_PART() function takes three arguments: the source string, delimiter, and instance of delimiter to extract part of the string.
In this case, the source string will be the employeename column, and the delimiter will be the empty space between first and middle names. The third argument tells the function to only select the string up to the first encountered delimiter.
We also select the totalpaybenefits column because we need to output it.
WITH tpb AS
  (SELECT LOWER(SPLIT_PART(employeename, ' ', 1)),
          totalpaybenefits
   FROM sf_public_salaries
   WHERE otherpay > basepay)
SELECT *
FROM tpb
WHERE totalpaybenefits =
    (SELECT min(totalpaybenefits)
     FROM tpb)
Output
Final answer shows the first name and total pay of the lowest paid employee.
Final words
In this article we explained Postgres aggregate functions and showed how to use them to answer actual interview questions. Working on these challenges can help you improve your proficiency in aggregate functions in PostgreSQL.
On StrataScratch, you can find more PostgreSQL questions to answer. Our platform contains hundreds of questions asked during interviews at the largest US organizations. Each question comes with pointers to help you get to the answer if you get stuck.
You can even filter interview questions by language (PostgreSQL or MySQL, for example). You can filter questions by a specific feature, like aggregate functions. This is great if you want to practice advanced features like SQL rank functions or SQL window functions.
Share


