Noom Interview Questions for Data Scientist Position

Categories:
 Written by:
Nathan Rosidi
A list of real-life Noom interview questions for data scientist positions. We'll go through the questions in more detail and help you with the solutions.
Introduction
Working at Noom is becoming an important goal for many data scientists. This fitness and lifestyle app which uses psychology and computer science to “disrupt the weight loss industry” is growing at enormous speeds; in 2019, their revenue quadrupled to a staggering $237 million. Not bad for an app that just launched back in 2016. Currently, Noom has around 45 million subscribers worldwide.
With that in mind, we thought it would be useful to offer some insights on how to get a job as a data scientist at Noom. We have prepared a list of real-life Noom interview questions that are asked for data scientist positions at Noom. We will go through all these Noom data science interview questions in more detail and help you with the solutions. Furthermore, we will highlight why these interview questions are asked and what technical concepts are covered through them.
Technical Concepts Tested in Noom Interview Questions
In this section, we will cover all the technical concepts tested in Noom interview questions from this article. Furthermore, we will discuss the nature of the questions and how these Noom interview questions are related to the technical concepts.
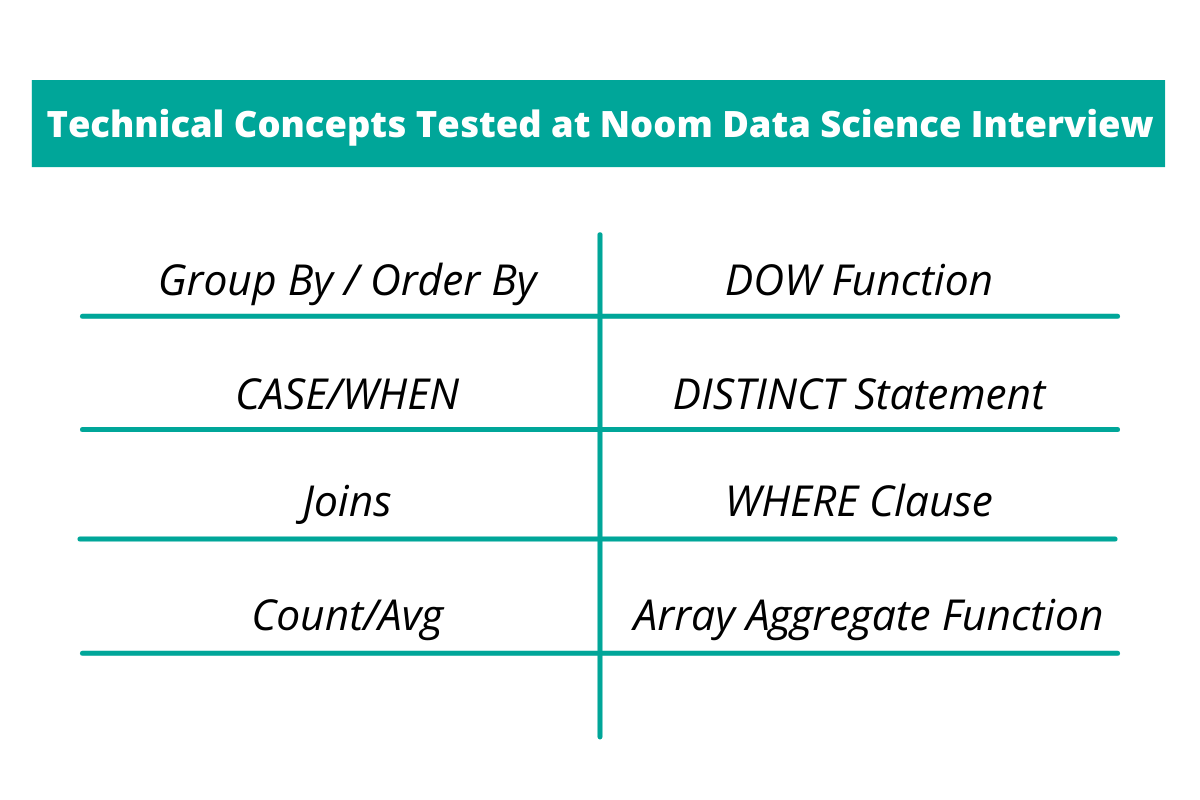
The table below shows the main technical concepts being tested at Noom, based on the questions covered in this article:

As we can see, all concepts tested at interviews are used to manipulate data in certain ways and get outputs based on the set criteria. The outputs which need to be produced might require the knowledge of the technical concepts as well. For example, you could be asked to return user signups per day and sort the results in descending order; to do this you will need to know technical concepts such as data counting, grouping, aggregating and ordering.
There can be interview questions of other nature as well, where you would be asked to output a table that contains signups, billing cycles and weekdays, ordered in a certain way. To produce this table, you will need to know concepts such as date of week function, case/when clauses, distinct statements and data joins. Now let’s see what types of questions are being asked on data science interviews at Noom.
Noom Interview Question #1: Find the Most Profitable Location
Question Link: https://platform.stratascratch.com/coding/2033-find-the-most-profitable-location
Last Updated: April 2021
Find the most profitable location. Write a query that calculates the average signup duration in days and the average transaction amount for each location. Then, calculate the ratio of average transaction amount to average duration.
Your output should include the location, average signup duration (in days), average transaction amount, and the ratio. Sort the results by ratio in descending order.
We are being asked to calculate the most profitable location. To do this, we need to write a query that returns the highest average revenue per signup day. Furthermore, we need to calculate the average signup duration and average revenue for each location and then compare these two measures together. Finally, we need to sort the output by location from the highest ratio to the lowest. The difficulty level for this question is hard.
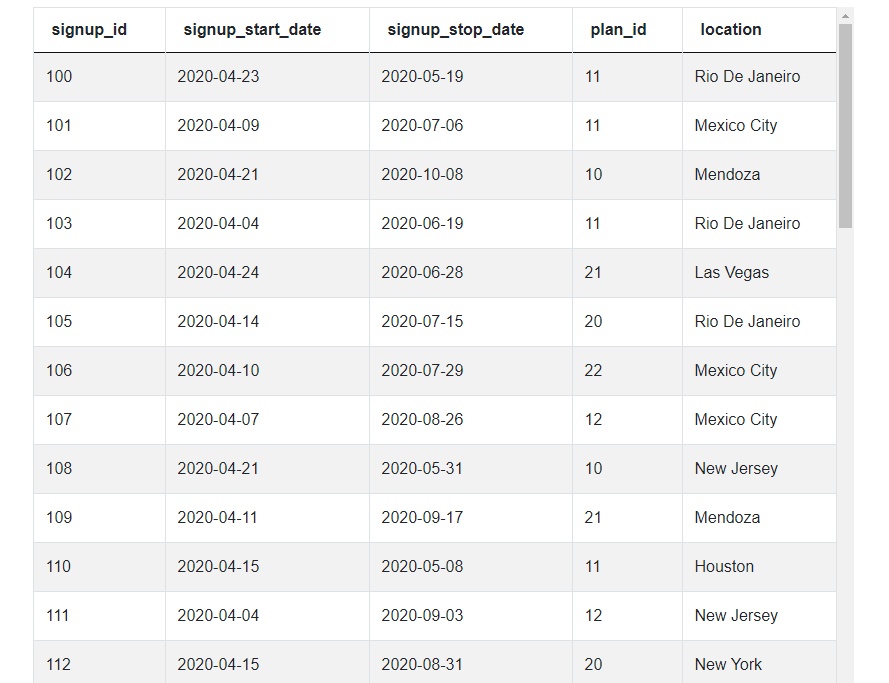
Here is a sample of what the data looks like:
As we can see, there are two data tables that we can work with, signups and transactions. We will need both tables to get the solution. The columns in signups table are signup id, signup start date, signup stop date, plan id and location. The columns in the transactions table are signup id, transaction id, transaction start date, transaction refunded date and amount (amt).
Here is the solution:
SELECT s1.location,
      mean_duration,
      mean_revenue,
      mean_revenue/mean_duration::float as ratio
FROM
  (SELECT location,
          avg(signup_stop_date::date - signup_start_date::date) as mean_duration
  FROM signups
  GROUP BY location) s1
JOIN
  (SELECT location,
          avg(amt) as mean_revenue
  FROM transactions t
  JOIN signups s ON t.signup_id = s.signup_id
  GROUP BY location) s2 ON s1.location = s2.location
ORDER BY ratio DESC
This is one of the hard Noom interview questions, so not to worry if you struggled with the solution. As you can see from the picture above, there are quite a few areas you would need to know in order to answer this Noom interview question. You will need knowledge of technical concepts such as joining tables, grouping data, running sub-queries and performing mathematical operations on the data. The reason this question gets asked on interviews is to verify whether you can do a query (with sub-queries) that pulls certain manipulated data from certain columns and then show the solution through mathematical operations to conform to the task at hand.
If trying to answer this question got your brain going, try answering the questions below yourself.
Noom Interview Question #2: List of Sign-Up IDs by Day
Question Link: https://platform.stratascratch.com/coding/2030-signup-by-day

Dataset:

What we are asked to do here is to write a query that returns list of signup IDs by day and we need to order the results by most signups in descending order. The difficulty level for this question is medium. The reason this Noom interview question is asked on their interviews is to verify whether you can run a query that returns aggregate data in a specified order according to the values. Technical concepts tested here are data grouping, counting, aggregating and ordering.
Approach:
The steps you can follow to solve the problem:
- Start a query that gives signup start date and aggregated array-type data from the signup id column;
- Group the data by signup start date;
- Order the data by counting in a descending order from the signup start date column.
Noom Interview Question #3: Sign-Ups by Billing Cycle and Weekday
Question Link: https://platform.stratascratch.com/coding/2032-signups-by-billing-cycle
Last Updated: April 2021
Write a query that returns a table containing the number of signups for each weekday and for each billing cycle frequency. The day of the week standard we expect is from Sunday as 0 to Saturday as 6.
Output the weekday number (e.g., 1, 2, 3) as rows in your table and the billing cycle frequency (e.g., annual, monthly, quarterly) as columns. If there are NULLs in the output replace them with zeroes.
Dataset:
To complete this task, we are asked to write a query that returns the table containing number of signups per billing cycle and per weekday. The data output should have weekday in rows and billing cycle in columns. As we can see from the attachments above, there is another table introduced for this challenge, the plans table. This table contains the following columns: id (plan id), billing cycle, average revenue and currency.
This is one of the medium difficulty level Noom interview questions. The reason this question gets asked on Noom interviews is to understand whether you can run queries with case/when clauses that return an output you need to define from the calculations you do. Technical concepts tested in this question are extracting and counting data, date of week function, case/when clauses, distinct statements and data joins.
Approach:
Here is a way you can get to the solution:
- Run a query that returns the following outputs:
- Extracted data from the signup start date arranged in days of week (and given a new variable);
- Counts distinct cases when billing cycle is annual to return annual values from signup id;
- Counts distinct cases when billing cycle is monthly to return annual values from signup id;
- Counts distinct cases when billing cycle is quarterly to return annual values from signup id;
- Join the data from two tables on plan id column;
- Group the output by 1.
Noom Interview Question #4: Average Transaction Value by Billing Method and Sign-Up ID
Question Link: https://platform.stratascratch.com/coding/2031-transactions-by-billing-method-and-signup-id
Last Updated: April 2021
Provide a list of signups with a transaction start date earlier than May 2020.
For these users, calculate the average transaction value using only transactions that occurred before May 2020, grouped by billing cycle.
The output should include the billing cycle, signup ID, and average transaction amount, sorted by billing cycle in reverse alphabetical order and signup ID in ascending order
Dataset:
Here we are asked to get the list of signups that have a transaction started earlier than 10 months ago and get the average transaction value for all of those users. The data needs to be grouped by billing cycle. The output should contain billing cycle, signup id and average value. In the output, billing cycle should be sorted in a descending and signup id in an ascending order. We can see that all three data tables are to be used in order to answer this question.
This is one of the hard Noom interview questions for data scientist position, so we will cover the solution approach step-by-step. The reason this question gets asked on Noom interviews is to verify whether you can run queries that contain multiple data joins, data manipulation functions and output conditions. Technical concepts being tested in this Noom interview question are joins, grouping/ordering data, where clause and now time function.
Approach:
One of the ways you can solve this problem:
- Run a query that returns billing cycle, signup id and averages the amount column as outputs;
- Join signups and transactions tables on signup id;
- Join plans and signups table on plan id (id);
- Set a clause where transaction start date needs to be lower than current time (now function) minus 10 1-month intervals;
- Group the data by billing cycle and signup id;
- Order the billing cycle data in descending and signup id data in ascending order.
Conclusion
The goal of this article was to give a real-life outlook of what some typical data science interview questions at prospective companies like Noom are. For the questions which do not have offered solutions, we hope that using hints from our approach helped you get the desired result. If you are still struggling with the solutions, feel free to visit our website and check out the correct answers.
Share


