Data Analytics Project Ideas That Will Get You The Job

 Written by:
Nathan Rosidi
Data analytics project ideas that can boost your portfolio and help you land a data science job.
The best way to get a job in data science is to showcase your skills with a portfolio of data analytics projects. Data analytics projects not only help you in getting your first job but also help you to gain more exposure to data science. Some helpful projects will upskill you as well as make your resume more impressive.
In this article, we’ll talk about the one data analytics project idea that you need. The only project you need to build, that’ll help you gain full-stack data science experience, and impress interviewers on your interviews if your goal is to jumpstart your career in data science. We’ll break down the components of what a good data science project includes and exactly what an interviewer is looking for in a project and why they’re looking for it.
Data Analytics Project Ideas that You Need to Stay Away From
One piece of advice before we start talking about the components of a good project – There are two things you need to stay away from when you are trying to find or build a data analytics project.
1. Avoid any analysis with the Titanic or Iris dataset.
- It’s been done to death.
- Your employer doesn’t care about your survival classifier.
2. Kaggle
- It’s a great place to start when you’re just beginning. But it’s too commonplace and ordinary. So unless you can get ranked in the top 10, just move on from Kaggle.
We suggest not to include common projects in your resume or portfolio. You need to stay away from the most common data analytics project ideas.
Components of a Good Data Analytics Project that can Impress Anyone
To understand this one and only data analytics project idea, let's break down the components of exactly what an interviewer is looking for in a data science project and why they’re looking for it.
What an interviewer looks for is a data scientist with real-world skills -- both in analytics/coding and in using modern technologies. This helps you get closer to becoming a full-stack (or fully independent) data scientist.
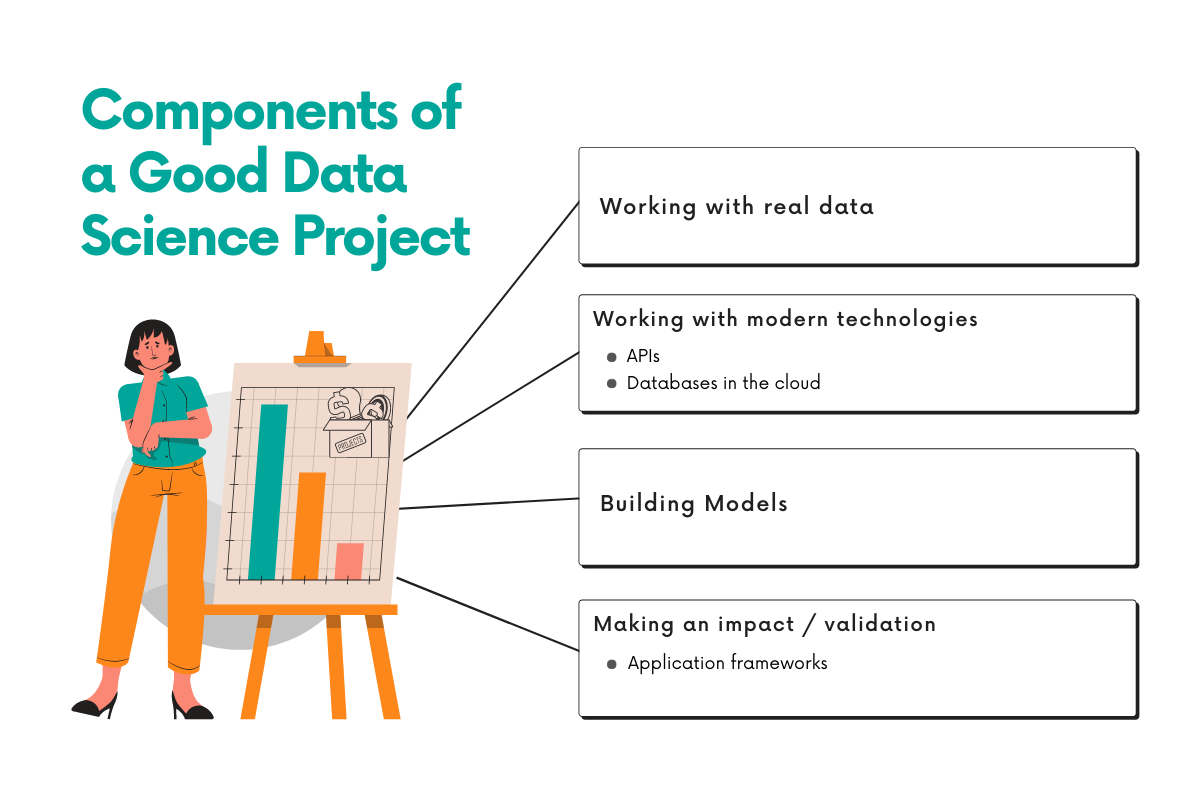
A quick break down of the components of a good data analytics project:
- Working with real data
- Working with modern technologies
- APIs
- Databases in the cloud
- Building models
- Making an impact / validation
- Application frameworks
1. Working with Real Data
Working with real data refers specifically to the data that gets updated in real-time. Working with real data that users produce and working with data that is produced in real-time helps prove to the interviewer that you know how to work with relevant and timely data. Not analyzing some data that was produced in 1912, like the titanic dataset.
So having said that, you’re probably asking, how do you get this data? This is a perfect segway into component #2.
2. Working with Modern Technologies
API
How are you going to get that real-life data that is updated in real-time?
You can use APIs to collect that data. Almost all apps and platforms these days rely on APIs to collect and pass information. Learning how to use APIs to get the data that you need for your analysis shows the interviewer that you have relevant skills to do the job.
Some popular examples of APIs are Twitter, Netflix, and Amazon. A good API for data analysis will include:
- Real-time updates
- Date and timestamps for each record
- Geolocations
- Numbers and text for data
Other API examples can be:
- https://www.twilio.com/blog/cool-apis
- https://www.quora.com/What-are-the-most-popular-APIs
The skills you’re trying to learn when working with APIs are to:
- Learn how to set up and configure APIs in your code (for example, dealing with API tokens)
- Learn to use libraries, like python libraries, that help you make API calls
- How to work with data structures like JSON and dictionaries to help you collect the data
This is something you’d be using at the job often so as an interviewer, I’d start to see you as an experienced data scientist, not one that’s an absolute beginner.
Databases on the cloud
‘Databases in the cloud’ is the second modern technology. Once you collect the data from the API and maybe after you clean the data, you probably want to store it in a database. Why?
- Because as it’s mentioned before, the data you pulled from the API is updated continuously, so if you pull the data again, you’ll get new records. So instead of pulling the entire dataset and cleaning all of it again, it’s nice to just pull and clean only the new records and store the old ones in a database when they’re safe.
- Every company uses databases and many use cloud services like AWS and Google Cloud. Knowing how to build a data pipeline with a cloud provider is a real skillset to have and will definitely set you apart from others. If you have this experience, your interviewer would be very impressed because the interviewer knows that you can hit the ground running from day 1 on the job.
3. Building Models
This gets us to the part of a data analytics project you probably thought was most important -- building models. It’s important to learn how to implement a model -- whether regression or some type of machine learning model. And that’s why you’ve been told to start with Kaggle because they could give you experience on how to build ML models. So if you just don’t have a lot of experience building models in general, you can start with Kaggle.
While getting experience in building models is important, there’s another aspect that’s even more important -- It’s the decisions you make and why you made them while building your model that is even more important.
Here are some questions you’ll need to answer when implementing your model. You’ll need to be able to eloquently explain your answers to these questions in an interview, otherwise no matter how good your model is, no one would be able to trust it:
- Why did you pick your model? Why that particular model? What are you trying to accomplish with this model that you couldn’t do with others?
- How did you clean the data? Why did you clean it that way?
- What type of validation tests did you perform on the data to prepare it for the model?
- Tell me about the assumptions of your model? How did you validate them?
- How did you optimize your model? What were the trade-off decisions you made?
- How did you implement your test/control?
- Tell me about how the underlying math in the model works.
What you don’t see in this line of questions is how your model performed. Your interviewer doesn’t care too much about that. Your interviewer care about your thought process and how you made decisions. And if you understand the underlying theory of the model.
4. Making an Impact / Getting Validation
Lastly, how do you know if you’ve built a great project? Your project should make an impact. You should have some validation from others.
You’re building and coding to improve your skills. But the job of a data scientist is to help others by turning data into insights to provide recommendations that make an impact on the business. How do you know if your insights and recommendations are valuable if you’re building by yourself and showing nobody? You need to show your work to others and build something they find valuable.
There are 3 ways to do this.
- The easiest way is to share your code with others in various data science communities like Reddit r/datascience or r/machinelearning. You can put your code in a git repo and share it that way. It’s a low effort lift that might not get the best engagement with the community.
- Another better way is to output your insights in the form of visuals and graphs-- build nice looking graphs that are interesting to look at. Share your graphs and write up your interpretation as some sort of blog article. You can get instant feedback if you share your insights on the data science publications like Towards Data Science on Medium and various subreddits like r/dataisbeautiful.
- And lastly, the hardest way is learning an application framework like Django or Flask. Deploy your application using a cloud provider like AWS or Google Cloud and serve your insights that way. Your insights can be an interactive dashboard that you build using Plotly or a simple API that allows others to pull data from your application. This is obviously the hardest, most involved way to share your work but it is worth it if you want to learn how to become a full-stack data scientist and gain software development experience.
The main point is to show that what you built is valuable and people care about your work. Show the impact of your work. Interviewers and your teammates would be impressed.
Also, check out our data science interview preparation guide that covers tips on topics covered during the interviews.
Examples of a Good Data Analytics Project
In the previous sections, we covered the essential components of a good data analytics project - working with real-life data, modern technologies, building models, and making an impact.
Now, we will provide some real-life examples of data analytics projects that have successfully incorporated these components to help you gain a better understanding of how they can be applied in practice.
By examining these examples, you can gain a better understanding of the various challenges and opportunities that arise when working with real-life data and modern technologies.
And also, you can start to develop a mindset that is focused on creating impactful projects that not only demonstrate your technical skills but also provide value to the community or industry.
Furthermore, we will provide you with the resources and recommendations for where to find the relevant data for your project so that you can get started right away.
Let’s get started with real-time air quality monitoring.
Real-time Air Quality Monitoring
The real-time air quality monitoring project involves collecting sensor data from various locations and processing it using machine learning models to provide accurate air quality forecasts.
This data analytics project can help identify high-risk areas and pollutant sources, as well as suggest pollution control strategies and policies.
Let’s break down this project into different steps.
Real-life data: Air quality sensor data from various locations.
Modern technologies: The OpenAQ platform is a great source of real-time air quality data that is collected from various sources around the world. You can use their API to access and integrate the data into your project.
Building models: The air quality data can be modeled using various techniques, such as regression models, time-series analysis, and deep learning methods like convolutional neural networks (CNNs) or long short-term memory (LSTM) networks.
Impact/Validate: To demonstrate the impact of the air quality monitoring project, you can share your findings with the local government, environmental organizations, or public health agencies. You can also create a website or mobile app that displays real-time air quality data, provides health recommendations, and receives user feedback.
By sharing your project with the community, you can raise awareness of air quality issues, for example, this can encourage public participation in pollution control efforts.
Traffic Management and Optimization

The traffic management and optimization project involves collecting traffic data from various sources, including sensors, GPS devices, and mobile phones, and using machine learning models to predict traffic flow and congestion. The project can help optimize transportation routes, reduce travel time and fuel consumption, and improve road safety and infrastructure.
Let’s break down this project into four steps.
Real-life data: Traffic data from sensors and GPS devices.
Modern technologies: Google Maps provides a traffic API, here, that you can use to access real-time traffic data for various cities and regions around the world.
Microsoft BING also offers a Traffic API that shows traffic incidents and issues, such as construction sites and traffic congestion.
Building models: The traffic data can be modeled using various machine learning techniques, such as regression models, decision trees, and neural networks.
Impact/Validate: To demonstrate the effect of the traffic management and optimization project, you can share your findings with transportation departments, city planners, or private companies. You can also create a website or mobile app that provides real-time traffic information, suggests alternative routes, and tracks user feedback. By sharing your project with the community, you can help reduce traffic congestion and improve transportation infrastructure.
Energy Consumption Analysis and Optimization

The energy consumption analysis and optimization project involves collecting energy consumption data from buildings and households and using machine learning models to predict and optimize energy use. This data analytics project can help identify energy-saving opportunities, reduce energy waste and costs, and promote sustainable energy practices.
Let’s break down this project into four steps.
Real-life data: Energy consumption data from buildings and households.
Modern technologies: The US Energy Information Administration (EIA) provides a wealth of energy consumption data for various sectors and regions in the US by using its API.
Additionally, you can use IoT devices to collect real-time energy usage data for buildings and households.
Building models: The energy consumption data can be modeled using various techniques, such as regression models, time-series analysis, and clustering algorithms.
Impact / Validate: To demonstrate the impact of the energy consumption analysis and optimization project, you can share your findings with building owners, energy providers, or sustainability organizations. You can also create a website or mobile app that displays real-time energy consumption data, provides energy-saving tips, and receives user feedback.
By sharing your project with the community, you can promote energy efficiency and reduce greenhouse gas emissions.
Customer Churn Prediction for Telecommunication Companies

The customer churn prediction project involves collecting customer data from telecommunication companies and using machine learning models to predict customer churn and recommend targeted marketing campaigns.
The project can help improve customer retention, reduce customer complaints, and increase revenue and profitability.
Let’s break down this project into four steps.
Real-life data: Customer data from telecommunication companies.
Modern technologies: Finding customer churn data can be challenging because it is often confidential. However, there are some publicly available datasets that you can use for your project.
For example, the IBM Watson Telco Customer Churn dataset is a popular dataset that contains customer data from a telecommunication company, but remember, it is not real-life data. It is a fictional one.
You can find through github this project has been done by several developers here, which might help you to get started.
Also, you can reach Foursquare data by using its developer’s API, and you can use sentiment analysis techniques to predict customer churn based on their reviews.
If you have access to customer data from a telecommunication company or other business, you can use that data to develop a more relevant and accurate churn prediction model.
However, you must ensure the data is obtained legally and follows the relevant data privacy and security regulations.
Here is a paper that includes an example of the customer churn prediction analysis in a telecommunication company with machine learning algorithms.
Building models: The customer churn data can be modeled using various machine learning techniques, such as logistic regression, decision trees, and support vector machines (SVM).
Impact/Validate: To demonstrate the impact of the customer churn prediction project, you can share your findings with the telecommunication company's marketing team, customer service department, or management team. You can also create a website or mobile app that provides personalized recommendations for customers, tracks user satisfaction, and receives feedback. By sharing your project with the community, you can improve customer retention and loyalty, increase revenue and profitability, and reduce customer complaints and churn rates.
Conclusion
Now, you’re probably thinking that this is a lot of work and includes so many different skills that it’s going to take your years to be able to master. And the answer is, yes, it’s supposed to take your years to master. The great part of these components is that you can work on them independently of each other. You can learn how to grab data from an API separately from learning how to work with databases. Master one component at a time and eventually you’ll master them all.
You don’t need to do multiple projects to master these skills. This is just one project. You’re building a data science infrastructure and learning the data science process.

Once you build the infrastructure like connecting to an API to pushing data to a database to building a model to produce nice visuals, you can use the exact same framework for other analyses, and probably just need to slightly revise your code at each step. You can use the same code to connect to a new API and grab a new dataset. Use similar code and techniques to clean your data. So on and so forth. Once you have the infrastructure built end-to-end, you can start working with other datasets and build other types of models using the same framework.
So keep iterating and improving and providing something of value to others, not just yourself. Hope this gives you some ideas for your next data analytics project. This project is something that would impress an interviewer if your goal is to get your first data science job.
Share
