Chi-Square Test in Python: A Technical Guide

 Written by:
Nathan Rosidi
Exploring Categorical Variables in Education Through Python's Chi-Square Test.
If you are wondering about which categorical feature has more effect on your target feature, you are at the right place.
In this article, we will use the Python Chi-Square test on datasets, collected from a Portuguese school, to find out the effective factors on the success of Math and Portuguese lessons, from school support to family backgrounds. But let’s start with an explanation of what the Chi-square test is.
What is Chi-square Test?
The Chi-Square Test is a statistical method used to find out if there is a significant association between two categorical variables.
For example, our datasets from Portuguese schools, the Chi-Square Test will help us analyze relationships between categorical variables like gender or internet access and students' academic performance in subjects like Mathematics and Portuguese.
Wait until the next section to know more about our dataset. Here is the dataset, we’ll use: https://archive.ics.uci.edu/dataset/320/student+performance
Data Exploration
The datasets, 'student-mat.csv' and 'student-por.csv', consist of detailed student records from two Portuguese schools. These records cover two main academic areas: Mathematics and Portuguese language.
The data sets provide a comprehensive view of factors influencing student performance. Let’s read these datasets, and explore them a little bit more.
import pandas as pd
# Reading the datasets
mat_data = pd.read_csv('student-mat.csv', sep=';')
por_data = pd.read_csv('student-por.csv', sep=';')
# Displaying the first few rows of each dataset for an initial overview
mat_data.head()
Here is the output.

Let’s see our second data frames first five rows.
por_data.head()Here is the output.

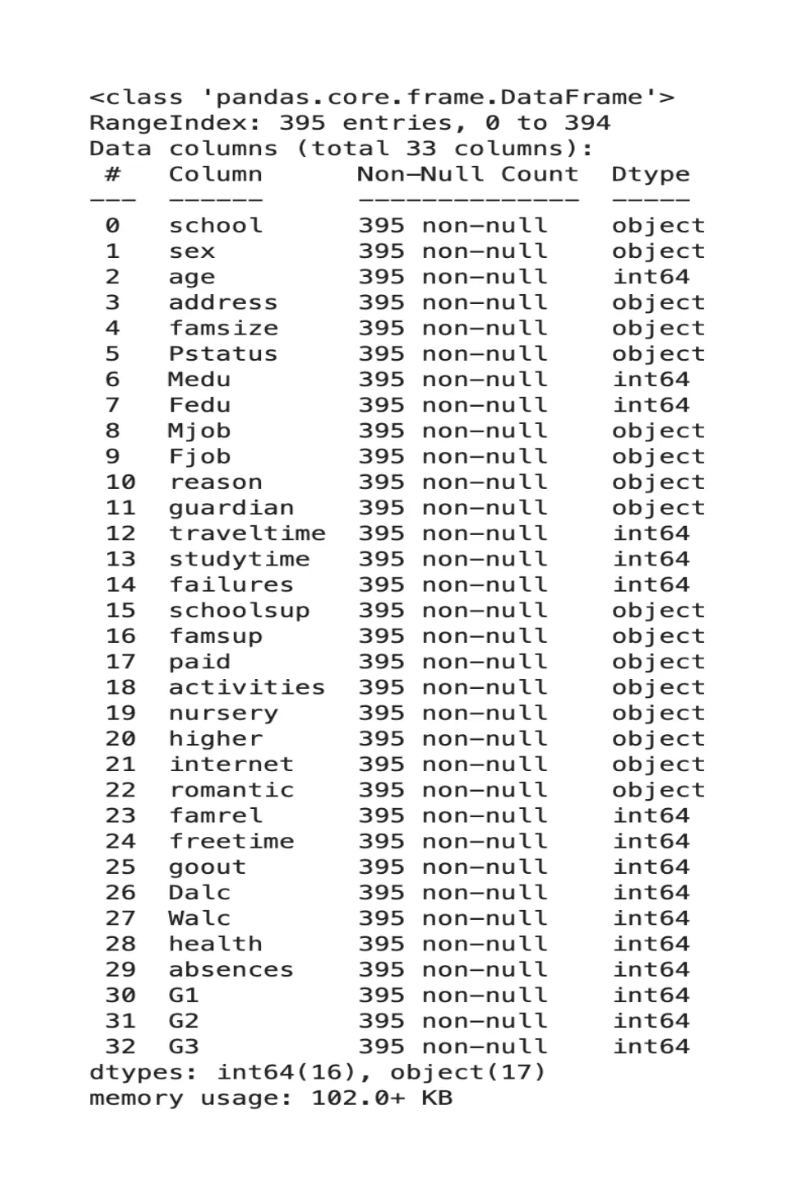
Great, it is time to collect more information. Let’s use info method to do that.
mat_data.info()
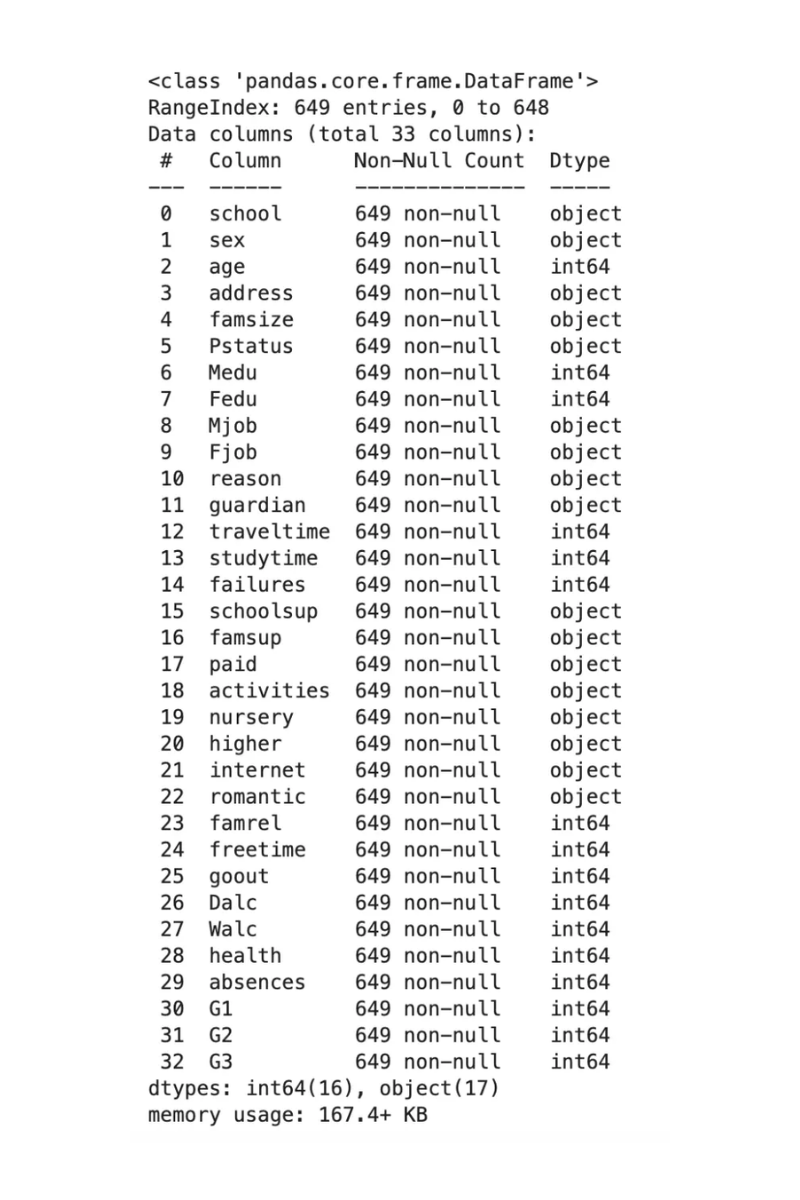
Let’s repeat the same thing with our second dataset too.
por_data.info()
Dataset Overview
As we said earlier, the data is gathered from two Portuguese schools and includes both academic and personal information of students.
Record Attributes:
- Demographic Information Includes age, sex, etc.
- School-Related Features Covers study time, failures, etc.
- Social Aspects Encompasses family size, parent's job, etc.
- Academic Grades G1, G2, and G3, where G3 is the final year grade, and G1 and G2 are the grades from the 1st and 2nd periods.
Summary Statistics
Next, we’ll examine the summary statistics of the datasets to understand the distribution, central tendencies, and variability of the data. This statistical analysis is important because it provides a foundational understanding of the datasets.
mat_data.describe()
(Mat) Dataset:
- Age: Students are between 15 and 22 years old, with an average age of about 16.7.
- Study Time: On average, students spend about 2 hours per week studying, with a standard deviation of 0.84 hours.
- Academic Failures: The average number of failures is 0.33.
- Grades (G1, G2, G3): The average grades for the 1st, 2nd, and final period (G1, G2, G3) hover around 10.9, 10.7, and 10.4, respectively.
por_data.describe()

(Por) Dataset:
- Age: Similar age distribution, with an average of approximately 16.7 years.
- Study Time: Average study time is slightly less than in the Mat dataset, at about 1.9 hours per week.
- Academic Failures: Lower average failures at 0.22.
- Grades (G1, G2, G3): The average grades are slightly higher than in the Mat dataset, with G1, G2, and G3 averaging around 11.4, 11.6, and 11.9, respectively.
Both datasets show a typical distribution for a student population, with grades reflecting a normal academic performance range. The next step will be to visualize this data for more insights.
Data Visualization

To complement our statistical understanding, we turn to data visualization.
This will help us to catch patterns, trends, and outliers better for both the Mathematics and Portuguese datasets.
Mathematics Dataset Visualizations
The code for creating these visualizations involves setting up histograms and boxplots for each column of interest.
This step is important because some patterns and variations may not be apparent from numerical statistics alone.
Let’s start visualizing mathematics dataset.
# Setting the aesthetic style of the plots
sns.set_style("whitegrid")

# Defining a function to create histograms and boxplots for specified columns
def plot_histograms_boxplots(data, columns, dataset_name):
    fig, axes = plt.subplots(len(columns), 2, figsize=(12, 4 * len(columns)))
    for i, col in enumerate(columns):
        # Histogram
        sns.histplot(data[col], kde=True, ax=axes[i, 0])
        axes[i, 0].set_title(f'Histogram of {col} in {dataset_name}')
        # Boxplot
        sns.boxplot(x=data[col], ax=axes[i, 1])
        axes[i, 1].set_title(f'Boxplot of {col} in {dataset_name}')
    plt.tight_layout()

# Columns of interest for both datasets
columns_of_interest = ['age', 'studytime', 'failures', 'G1', 'G2', 'G3']

# Plotting for Mathematics dataset
plot_histograms_boxplots(mat_data, columns_of_interest, 'Mathematics')
Let’s see the graph.

Insights
- Age: Most students are between 15-18 years old, with a few older students.
- Study Time: A large number of students study for 1-2 hours per week.
- Failures: Most students have no failures, with a few having one or more.
- Grades (G1, G2, G3): The grades are normally distributed, with some outliers, particularly in G2 and G3.
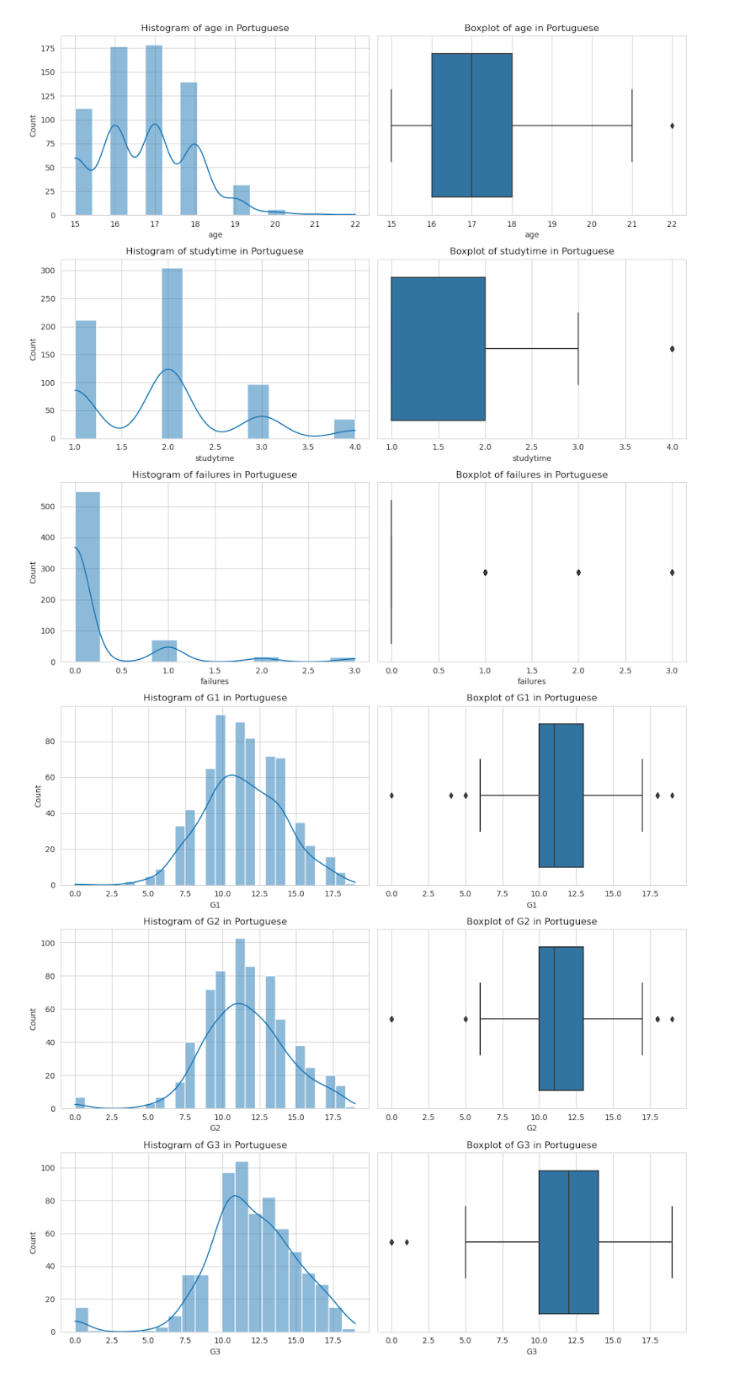
Portuguese Language Dataset Visualizations
Let’s continue with portugues language dataset visualizations. Here is the code.
# Plotting for Portuguese dataset
plot_histograms_boxplots(por_data, columns_of_interest, 'Portuguese')
Here is the output.

Insights
- Age: Similar age distribution to the Mathematics dataset.
- Study Time: The distribution is similar to the Mathematics dataset but slightly skewed towards lower study times.
- Failures: Very few failures, similar to the Mathematics dataset.
- Grades (G1, G2, G3): Grades are slightly higher and more evenly distributed compared to the Mathematics dataset.
Chi-Square Test for the Mathematics Dataset
The Python Chi-Square Test will help us understand if there are important relation between categorical variables in our datasets. For this analysis, we'll focus on the following aspects for the Mathematics dataset:
Application
In the four steps code below, here what we will do.
- Defining the Relationships: We focus on examining how different aspects influence students' grades.
- Creating Contingency Tables: For each relationship, we create contingency tables using the pd.crosstab method from the pandas library.
- Performing the Test: The chi2_contingency function from the scipy.stats library is used to perform the Chi-Square Test on each contingency table.
- Interpreting the Results: The output provides us with the Chi-Square statistic and the p-value for each test, which are used to determine if the associations are statistically significant.
Let’s see the code.
from scipy.stats import chi2_contingency
# Defining a function to perform the Chi-Square Test and interpret results
def perform_chi_square_test(data, col1, col2):
    # Creating a contingency table
    contingency_table = pd.crosstab(data[col1], data[col2])

    # Performing the Chi-Square Test
    chi2, p, dof, expected = chi2_contingency(contingency_table)

    # Interpreting the result
    significant = p < 0.05  # 5% significance level
    return chi2, p, significant

# Additional aspects to test in the Mathematics dataset
additional_aspects_to_test = {
    'School Support and Academic Performance': ('schoolsup', 'G3'),
    'Family Support and Grades': ('famsup', 'G3'),
    'Extra-Curricular Activities and Performance': ('activities', 'G3'),
    'Romantic Relationships and Academic Performance': ('romantic', 'G3'),
    'Health Status and Grades': ('health', 'G3')
}
# Performing the additional tests for Mathematics dataset
additional_mat_chi_square_results = {aspect: perform_chi_square_test(mat_data, *columns) for aspect, columns in additional_aspects_to_test.items()}
additional_mat_chi_square_results
Here is the output.

Results
Let’s evaluate the results.
School Support and Academic Performance: The Chi-Square value is 32.52 with a p-value of 0.013. This indicates a significant association between school support services and student grades.
Family Support and Grades: The Chi-Square value is 13.69 with a p-value of 0.69, suggesting no significant impact of family support on academic performance.
Extra-Curricular Activities and Performance: The Chi-Square value is 15.48 with a p-value of 0.56, indicating no significant effect of participation in extra-curricular activities on grades.
Romantic Relationships and Academic Performance: The Chi-Square value is 30.17 with a p-value of 0.025, showing a significant association between being in a romantic relationship and student grades.
Health Status and Grades: The Chi-Square value is 69.22 with a p-value of 0.44, suggesting no significant impact of health status on academic performance.
Chi-Square Test for the Portuguese Language
We will repeat the same thing we did in the previous section. This time we will compare these aspects;
- Relationship between Gender and Academic Performance: To see if there's a significant difference in performance between male and female students.
- Impact of Internet Access on Grades: Examining if having internet access at home influences student grades.
- Effect of Family Educational Background: Understanding if the educational level of parents affects student performance.
Application
Our application will be similar to previous one. Here, we just define different aspects to test.
# Aspects to test
aspects_to_test = {
    'Gender and Academic Performance': ('sex', 'G3'),
    'Internet Access and Grades': ('internet', 'G3'),
    'Family Educational Background and Performance': ('Medu', 'G3')
}
# Performing the tests for Portuguese dataset
por_chi_square_results = {aspect: perform_chi_square_test(por_data, *columns) for aspect, columns in aspects_to_test.items()}
por_chi_square_results
Here is the output.

Results
Let’s evaluate the results.
Gender and Academic Performance: The Chi-Square value is 21.91 with a p-value of 0.15, showing no significant association between gender and performance.
Internet Access and Grades: The Chi-Square value is 24.47 with a p-value of 0.08, again indicating no significant impact of internet access on grades.
Family Educational Background and Performance: The Chi-Square value is 116.85 with a p-value close to 0. This result suggests a significant association between the parents' educational level and student performance in Portuguese language.
These results indicate that for the Portuguese dataset, the educational background of the family is the only factor among the tested ones that significantly affects student performance.
Final Insights
In this section let’s look at some important evaluation we can do according to our results.
Actionable Insights
- School Support: Significant positive impact on Mathematics grades suggests that strengthening school support services could enhance student performance.
- Romantic Relationships The significant association with grades in Mathematics implies the need for guidance and counseling services that help students balance personal life with academic demands.
Statistical Significance
- The Chi-Square Tests revealed significant relationships in specific areas, notably in the influence of school support and romantic relationships on Mathematics grades, and the impact of family educational background on Portuguese language grades.
Recommendations
- Enhance School Support: Schools should consider expanding their support services, focusing on academic counseling and tutoring, especially for Mathematics.
- Counseling Services: Implement programs that offer guidance on managing personal relationships alongside academic responsibilities.
- Parental Involvement: Encourage parental involvement, especially in households with a lower educational background, to positively influence students’ performance in Portuguese language.
Future Research
- Longitudinal Studies: To better understand the long-term effects of these factors on academic performance.
- Qualitative Research: Interviews and focus groups with students could provide deeper insights into the impact of personal and social factors on their academic life.
- Comparative Studies Comparing these findings with other educational systems or age groups could offer a broader perspective on the influence of these factors on student achievement.
These insights and recommendations aim to contribute to the development of more effective educational strategies and support systems, ultimately enhancing student performance and well-being.
Conclusion
In this analysis of student performance in Portuguese schools reveals how factors like school support and family background impact learning, highlighting data science's role in enhancing education.
If you like what you read, also go through Python interview questions here which offers questions from leading tech companies, providing extensive resource for anyone aspiring to excel in the data science field.
Share


