Business Analytics vs Business Intelligence

 Written by:
Nathan Rosidi
Business intelligence and business analytics; so similar yet so different. Here’s an article about their differences and how they complement each other.
Is there a difference between business analytics (BA) and business intelligence (BI)? Yes. Otherwise, I wouldn’t spend writing more than a 3,000-word article when I could simply say: No!
Truth be told, some use business analytics and business intelligence interchangeably. They’re probably the same people who still think the 21st century started on 1 January 2020. (Twenty-odd years later, here’s spoiler alert: it began on 1 January 2021.) Don’t be one of those people.
Business analytics and business intelligence serve different purposes in organizations. In this article, I’ll explore what makes them distinct and their unique objectives, components, and tools. In the end, I’ll discuss how these differences complement each other and work towards the same general goal.
Business Analytics vs Business Intelligence: Definitions
Business analyst collects and analyzes historical and current data to predict future trends. It’s rooted in statistics, as its goal is to identify patterns in data, forecast future trends, and support the business decisions that will anticipate these trends.
The BI analyst also analyzes historical and current data but to help with current business operations. It does that by reporting on the past and current performance metrics.
Business Analytics vs Business Intelligence: Objectives
The overview of BA’s and BI’s objectives is shown in the figure below.

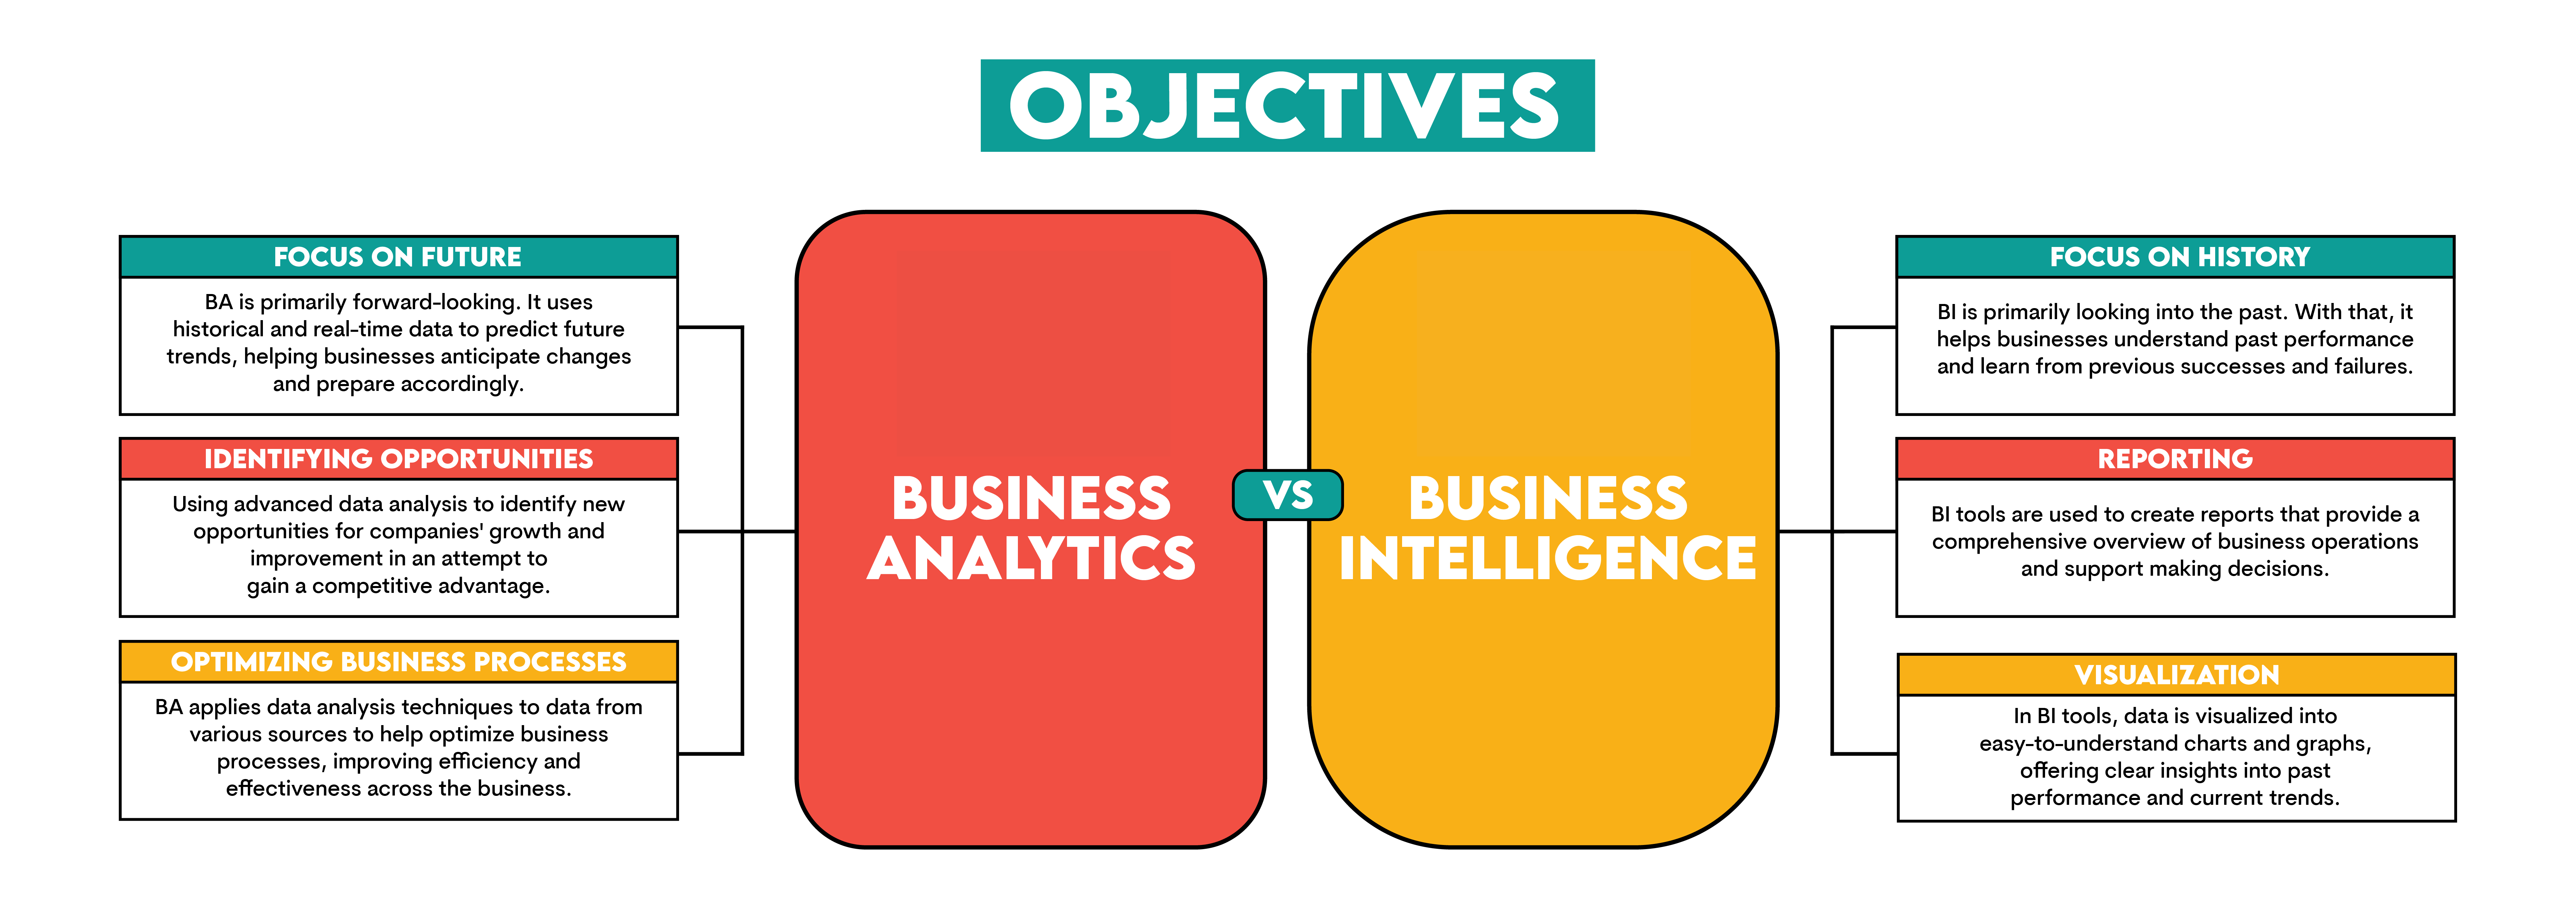
I’ll now go into more detail about each objective.
Business Analytics Objectives
Let’s start the overview of BA objectives with a focus on predicting future trends.
Focus on Predicting Future Trends
Business analytics is primarily forward-looking. It uses, that’s true, historical and real-time data. But it does that to predict future trends and outcomes. This is achieved by employing mainly predictive, sometimes even prescriptive data analysis.
Trends can refer to any segment of the organization’s business. So, business analytics can be leveraged to predict sales, costs, inventory, changes in share prices, interest rates, and FX rates, inventory level requirements, the need for a new product or an improvement of an existing one, the success of marketing campaigns, and staffing requirements; these are only some of the examples.
In short, BA turns business from being reactive to being proactive.
Identifying Opportunities
All these predicted future trends are not the purpose in themselves. Their goal is to identify opportunities for the company’s growth. These opportunities can range from undiscovered markets and customer segments to improving products and services, marketing and pricing strategies, churn reduction, optimizing supply chain or sales channels, recognizing seasonal trends, and innovation.
Optimizing Business Processes Through Data Analysis
BA also helps improve business processes in terms of efficiency and effectiveness. Using data and analyzing it can uncover inefficiencies and bottlenecks. With that also come recommendations on what and how to improve.
Optimizing business processes is one of the ways how businesses reduce costs, increase sales, or do both. For example, addressing the areas that cause delays in production means that the company will produce more and get products to their customer faster and in greater quantities.
The same is true with inventory management, optimizing delivery schedules and routes, workforce, sales channels, quality control, or any other business process.
Optimization can even include the complete automation of some processes.
Business Intelligence Objectives
The three main business intelligence objectives are historical data analysis, reporting, and visualization.
Emphasis on Historical Data Analysis
The primary type of data analysis used in BI is descriptive data analysis. This is because BI aims to analyze historical data and describe how the company has performed over time. By extracting trends, patterns, and anomalies from historical data, companies can learn from their mistakes and be more aware of what they’re doing right or wrong.
Unlike business analysis, business intelligence does not carry the proactive element, so the companies remain reactive if they engage only in BI.
Some examples of BI data analysis can be
- Sale performance analysis – to identify sales highs and lows and patterns in it
- Customer retention analysis – to calculate customer retention rates and discover factors influencing customers’ loyalty
- Financial reporting – creating financial reports to evaluate current performance metrics and compare them to previous periods
- Inventory turnover analysis – to calculate turnover rates and optimize stock levels
- Marketing campaign effectiveness – analyze marketing campaign metrics to improve future campaigns
- Employee performance review – analyze productivity metrics to identify over- and underperforming employees
- Supply chain efficiency – to analyze delivery times and costs of the suppliers
- Product quality assessment – calculating defect rates and common issues with the products to improve product quality
- Customer support metrics – analyzing customer support data to assess the level of customer support quality and areas that require improvement
- Website traffic analysis – analyzing historical website traffic data to understand user behavior and evaluate online content success
Reporting
The main tool BI has for presenting its analysis of historical data is reporting. BI tools are used to create reports that give an overview of business operations in a systematic and easy-to-understand way. The decision-makers get a complete picture of the company’s performance or one of its segments and can make decisions about the required improvements.
Visualization to Provide Insights into Past Performance and Current Trends
One of the most efficient ways to report BI insights is through data visualization. Complex data sets, many tables, and numbers; they take time to understand what’s going on. But with visualizations, it’s much easier!
For example, take a look at this graph.

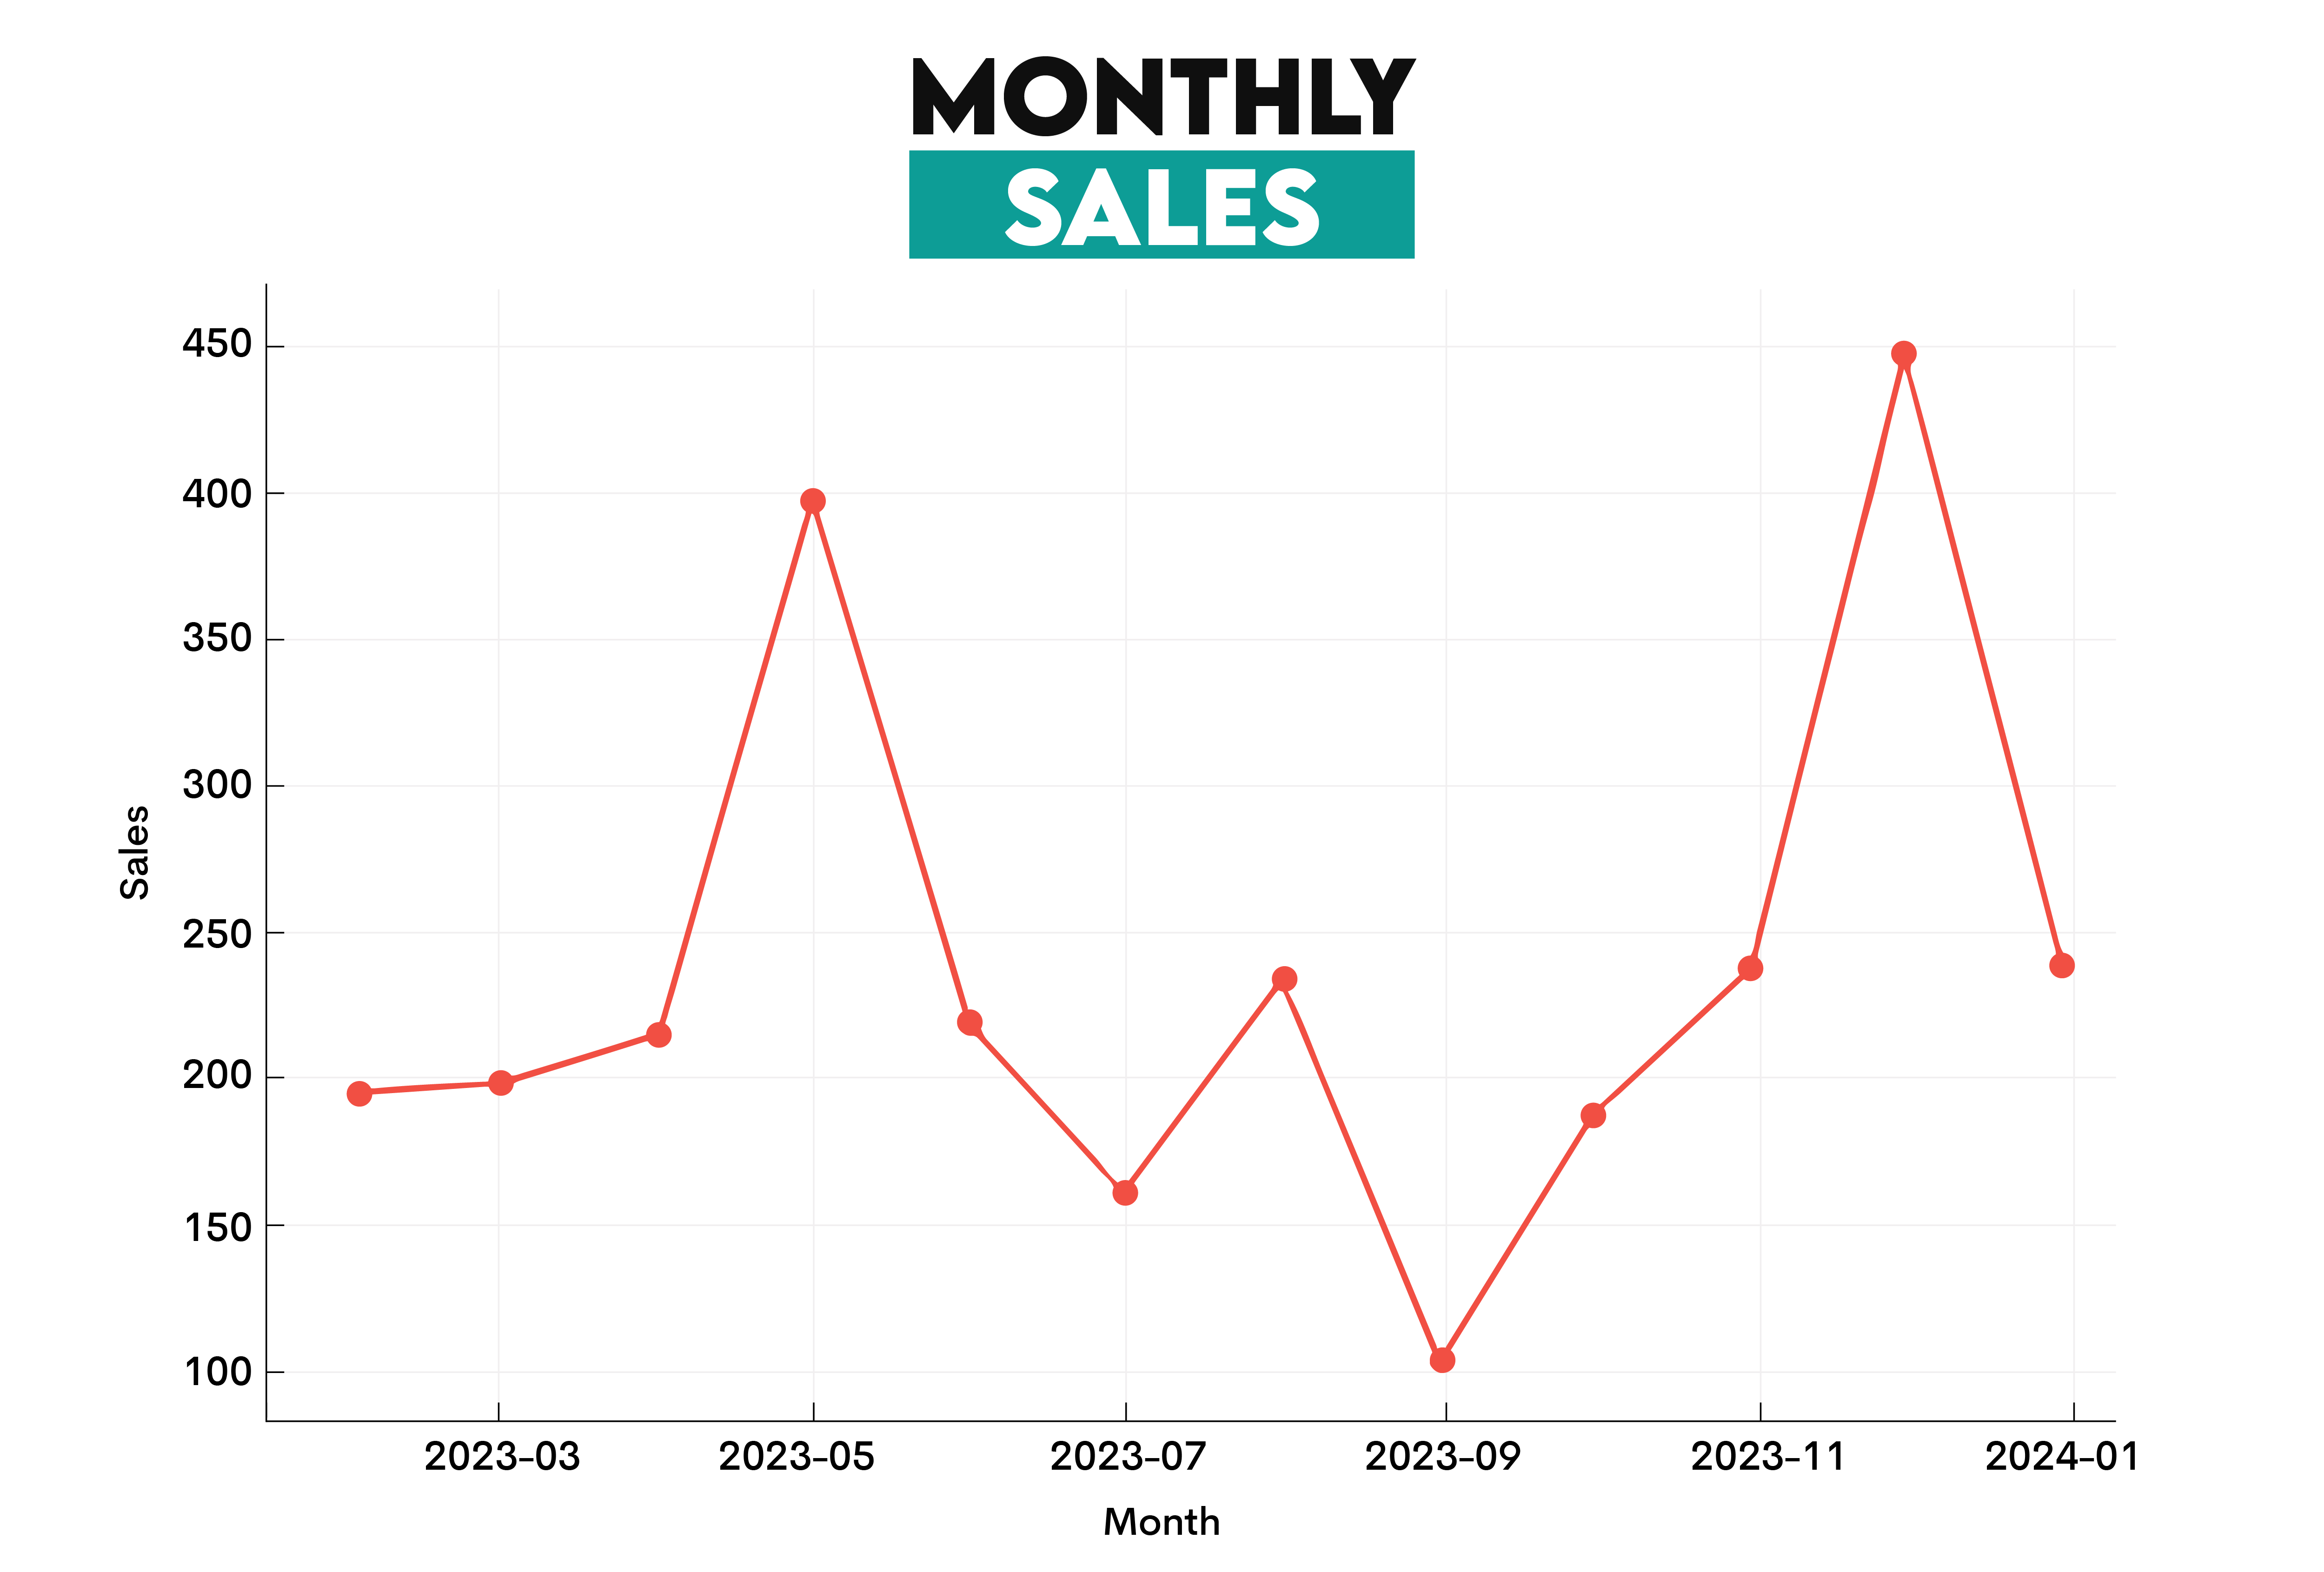
No explanations needed! One look at it is enough to see that May and June were the highest-selling months and that something went terribly wrong in September. But what? Is there a need for further investigation?
The CEO says no, everything is clear. He or she knows that this chart generally follows the seasonality of the company’s sales. The only exception is that dip. But, yeah, the CEO knows that September was the month the whole sales department quit due to being overworked, so no wonder the sales plummeted.
Using only one graph, you explained everything.
Visualizing data in this way makes it easier to understand trends, correlations, and outliers, which are much harder to unveil via tabular reports.
Very often, multiple charts are put together to create a dashboard. Instead of showing only a part of the picture, you show the whole; for example, you don’t show only a sales graph but also key performance indicators (KPIs) to give a comprehensive insight into overall performance or some areas.
BI reports can be interactive so that the users can play around with them. For instance, explore several “what-if” scenarios to simulate the impact of decisions before implementing them.
Business Analytics vs Business Intelligence: Key Components
Business analytics must do something different – almost magical – with historical data to extract insights and predict the future. What this ‘magic’ is can be seen in BA’s key components.

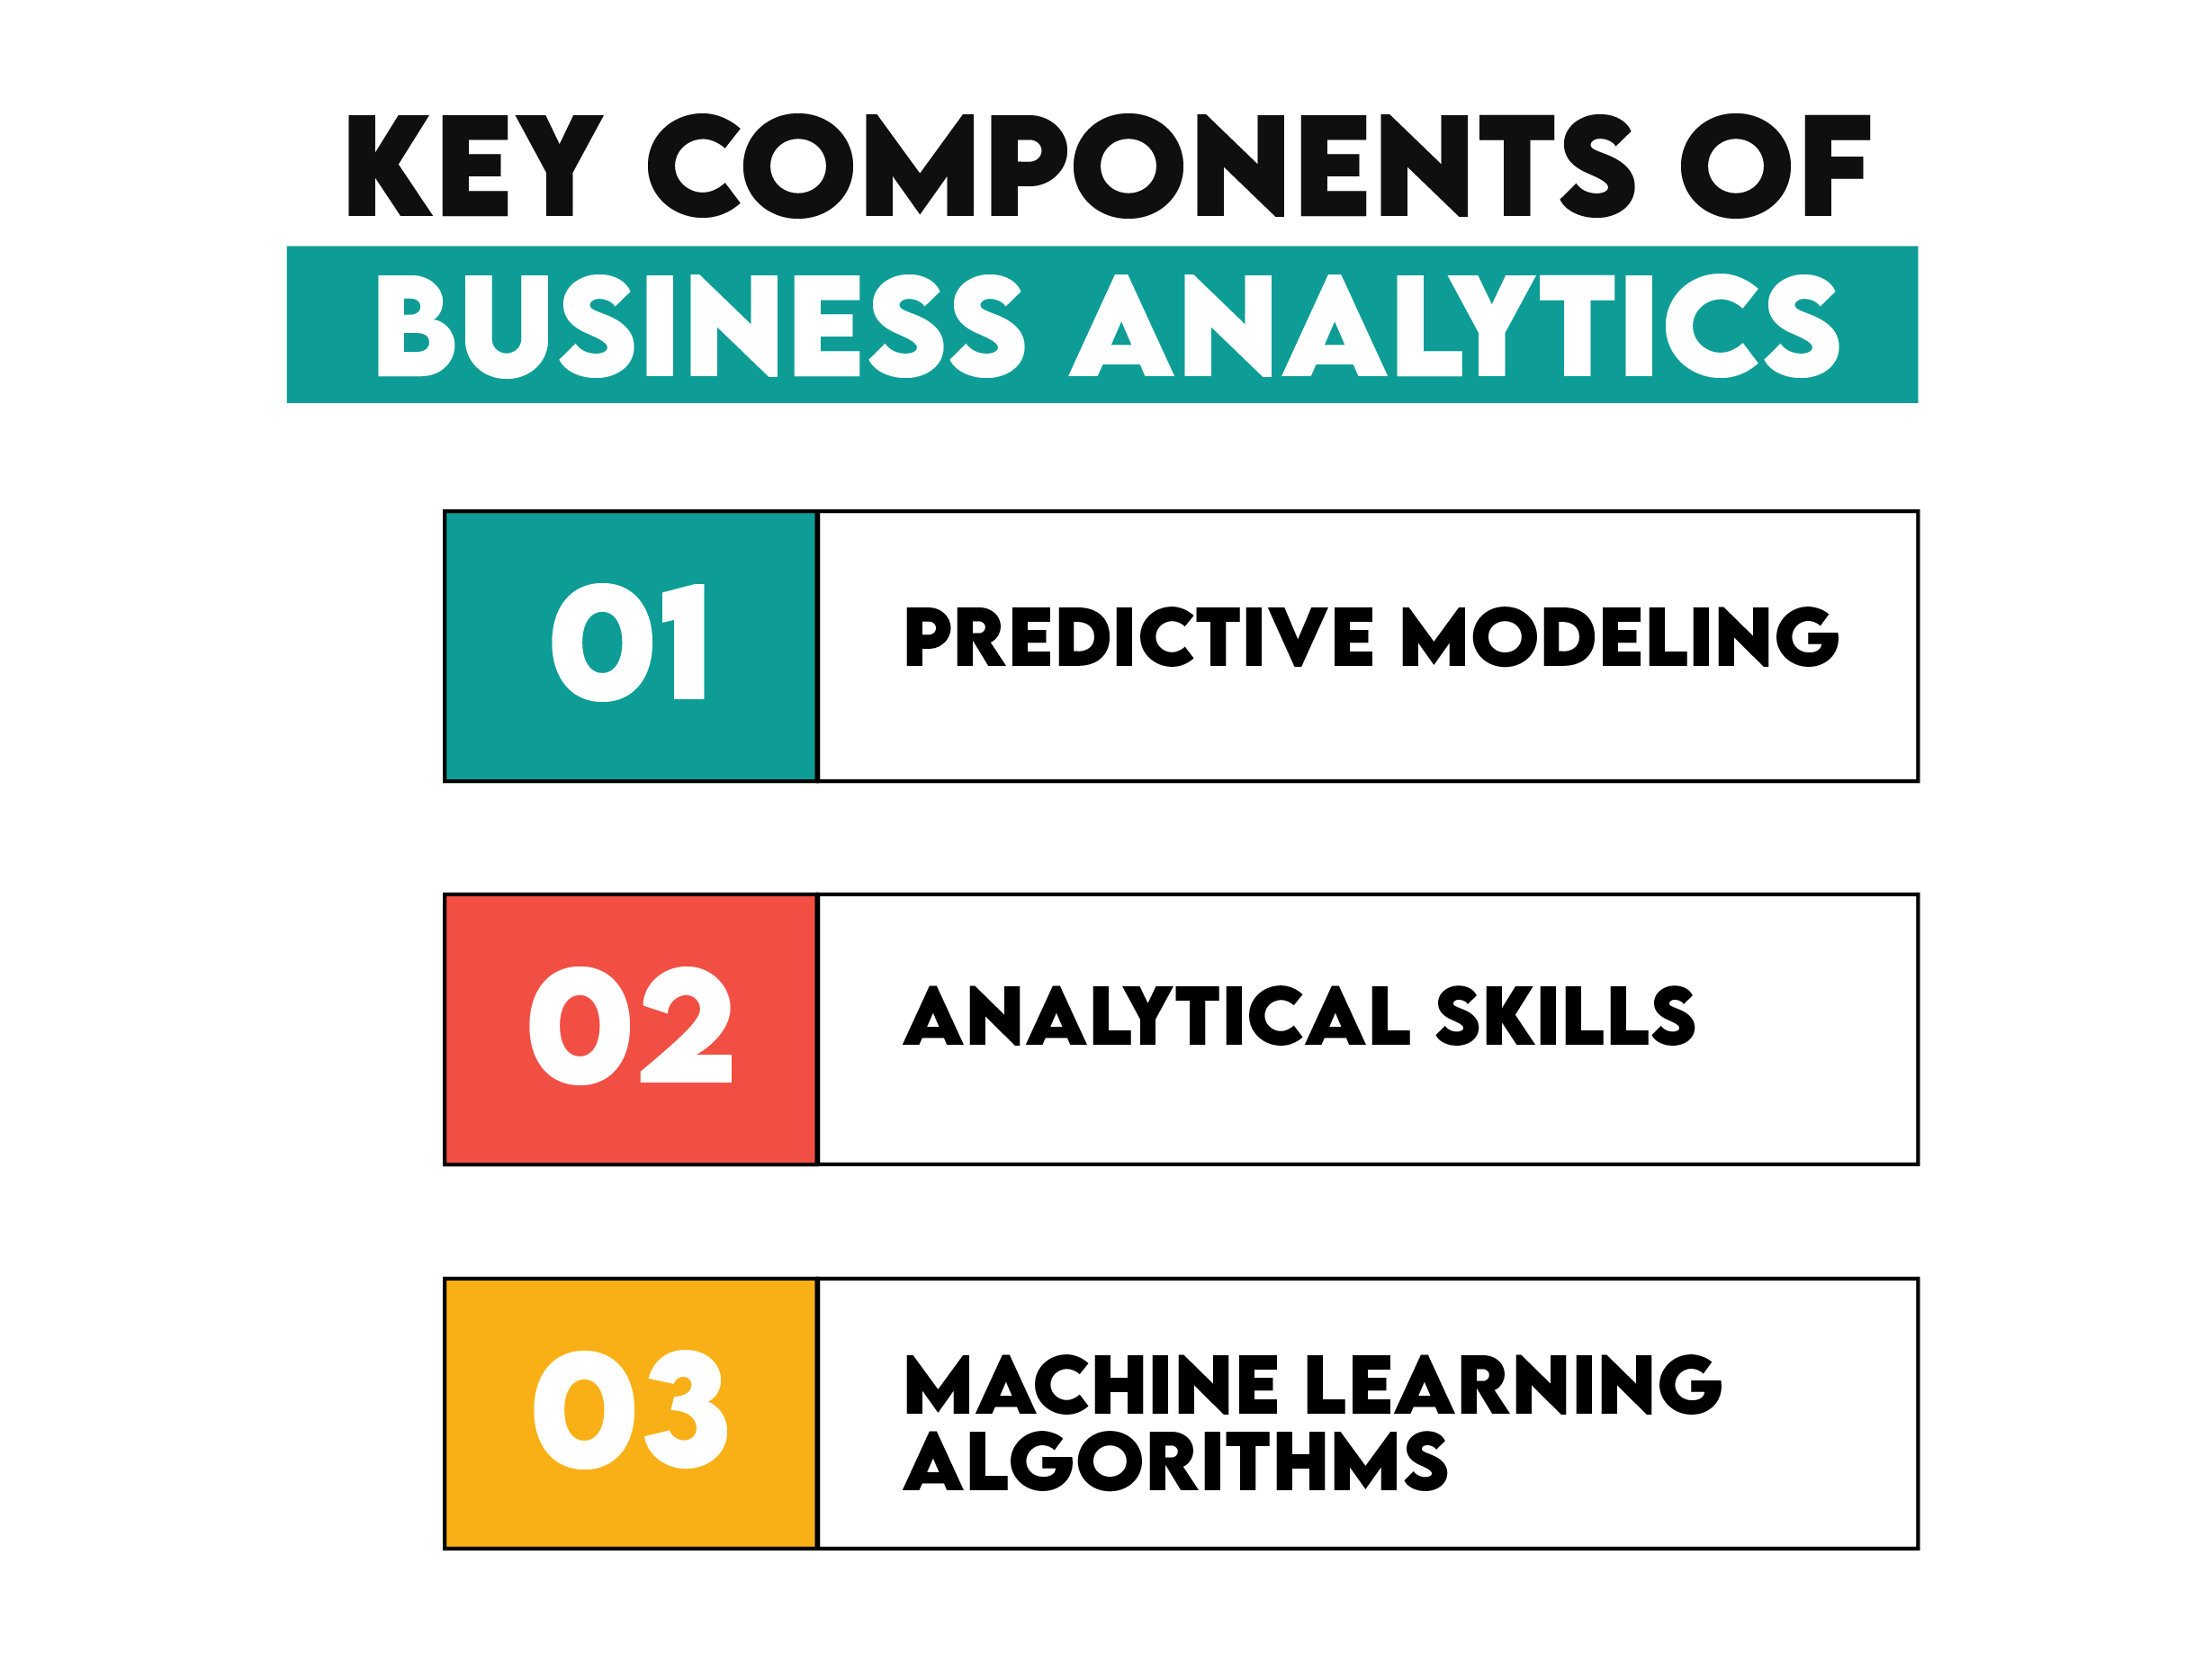
Business Analytics Key Components
BA Key Component #1: Predictive Modeling
Predictive modeling is a technique that uses historical data to build statistical models that predict future trends. Wow, predict the future, isn’t that precisely what BA's goal is? No wonder predictive modeling is its cornerstone.
Usually, predictive modeling consists of five steps.

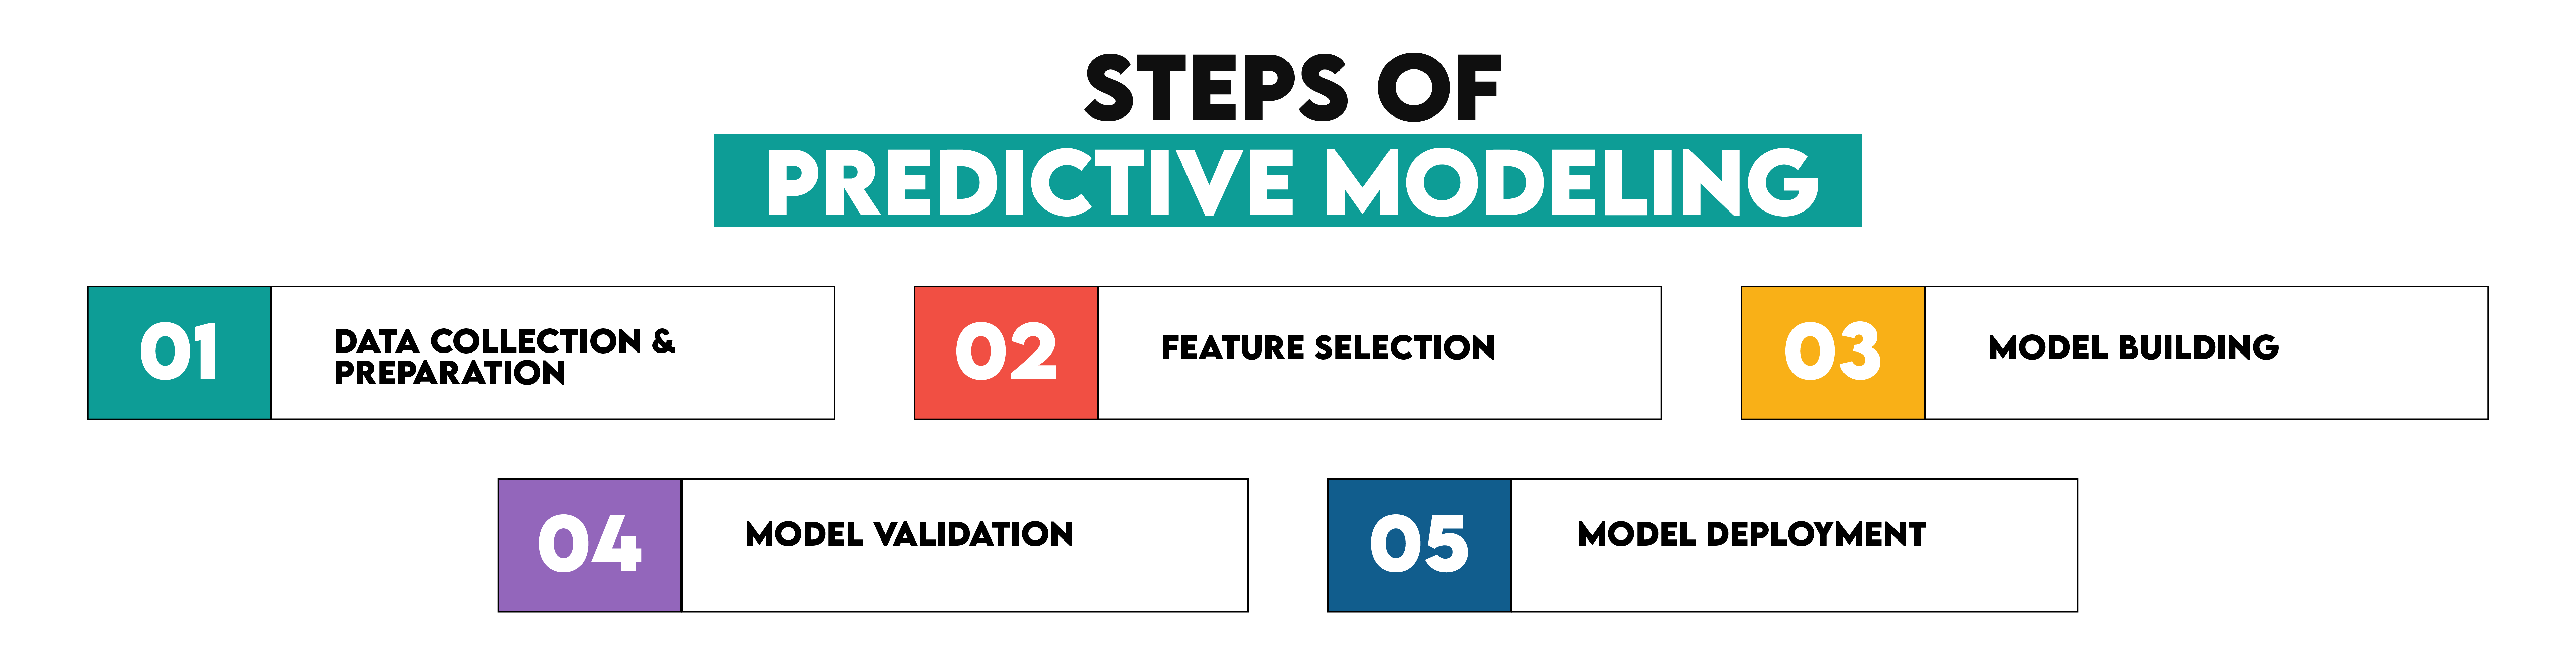
1. Data Collection and Preparation
The quality of predictive models depends on the quality and volume of data – the more and the higher quality, the better. Data is collected from various sources, such as databases, CRM systems, IoT devices, social media, and public datasets.
Since data quality and consistency are crucial, the data has to be cleaned and prepared for further phases. Missing values are filled in, formats are standardized, data is corrected, and duplicates are removed. Additionally, data is transformed through data normalization and scaling, encoding categorical variables, and creating new derived features.
2. Feature Selection
The second step in predictive modeling is feature selection. In this step, you must determine the variables that have the highest impact on the model’s ability to predict outcomes. It’s important to have enough such variables. However, it’s also important to get rid of those variables that don’t contribute anything to the model, only slowing down its performance.
Also, in this phase, you need to engineer features, which is exactly what it sounds like – creating new features from existing data. The purpose of this? Improving the model’s predictive power.
3. Model Building
This phase is about selecting the appropriate algorithm(s) and using them to train the model. What does training a model encompass? In general, letting the algorithm loose on the data and having it learn patterns and relationships between model features and target variable.
4. Model Validation
The purpose of model validation is to assess how good it is at its purpose – predicting future outcomes.
You’ll typically split the data into training and validation datasets. Then you’ll use performance metrics – Mean Absolute Error (MAE) & Root Mean Squared Error (RMSE), Precision & Recall, Area Under the Curve (AUC) – to see how well the model predicts.
Then, you’ll cross-validate to ensure that the model is good at generalizing to different data subsets; you’ll train and validate the model several times on different data splits.
5. Model Deployment
The final stage is when the model is deployed into production, i.e., into the real-world setting of the company’s business process.
Usually, you don’t just leave it there; the model needs to be monitored, fine-tuned, sometimes even updated, and recalibrated to ensure its high-quality performance.
BA Key Component #2: Machine Learning Algorithms
Machine learning is such a vast and important field forming the backbone of predictive modeling that it deserves to be discussed as a standalone BA component.
Machine learning algorithms make it possible for the models to learn from historical data. Broadly, these algorithms belong to three types of machine learning.
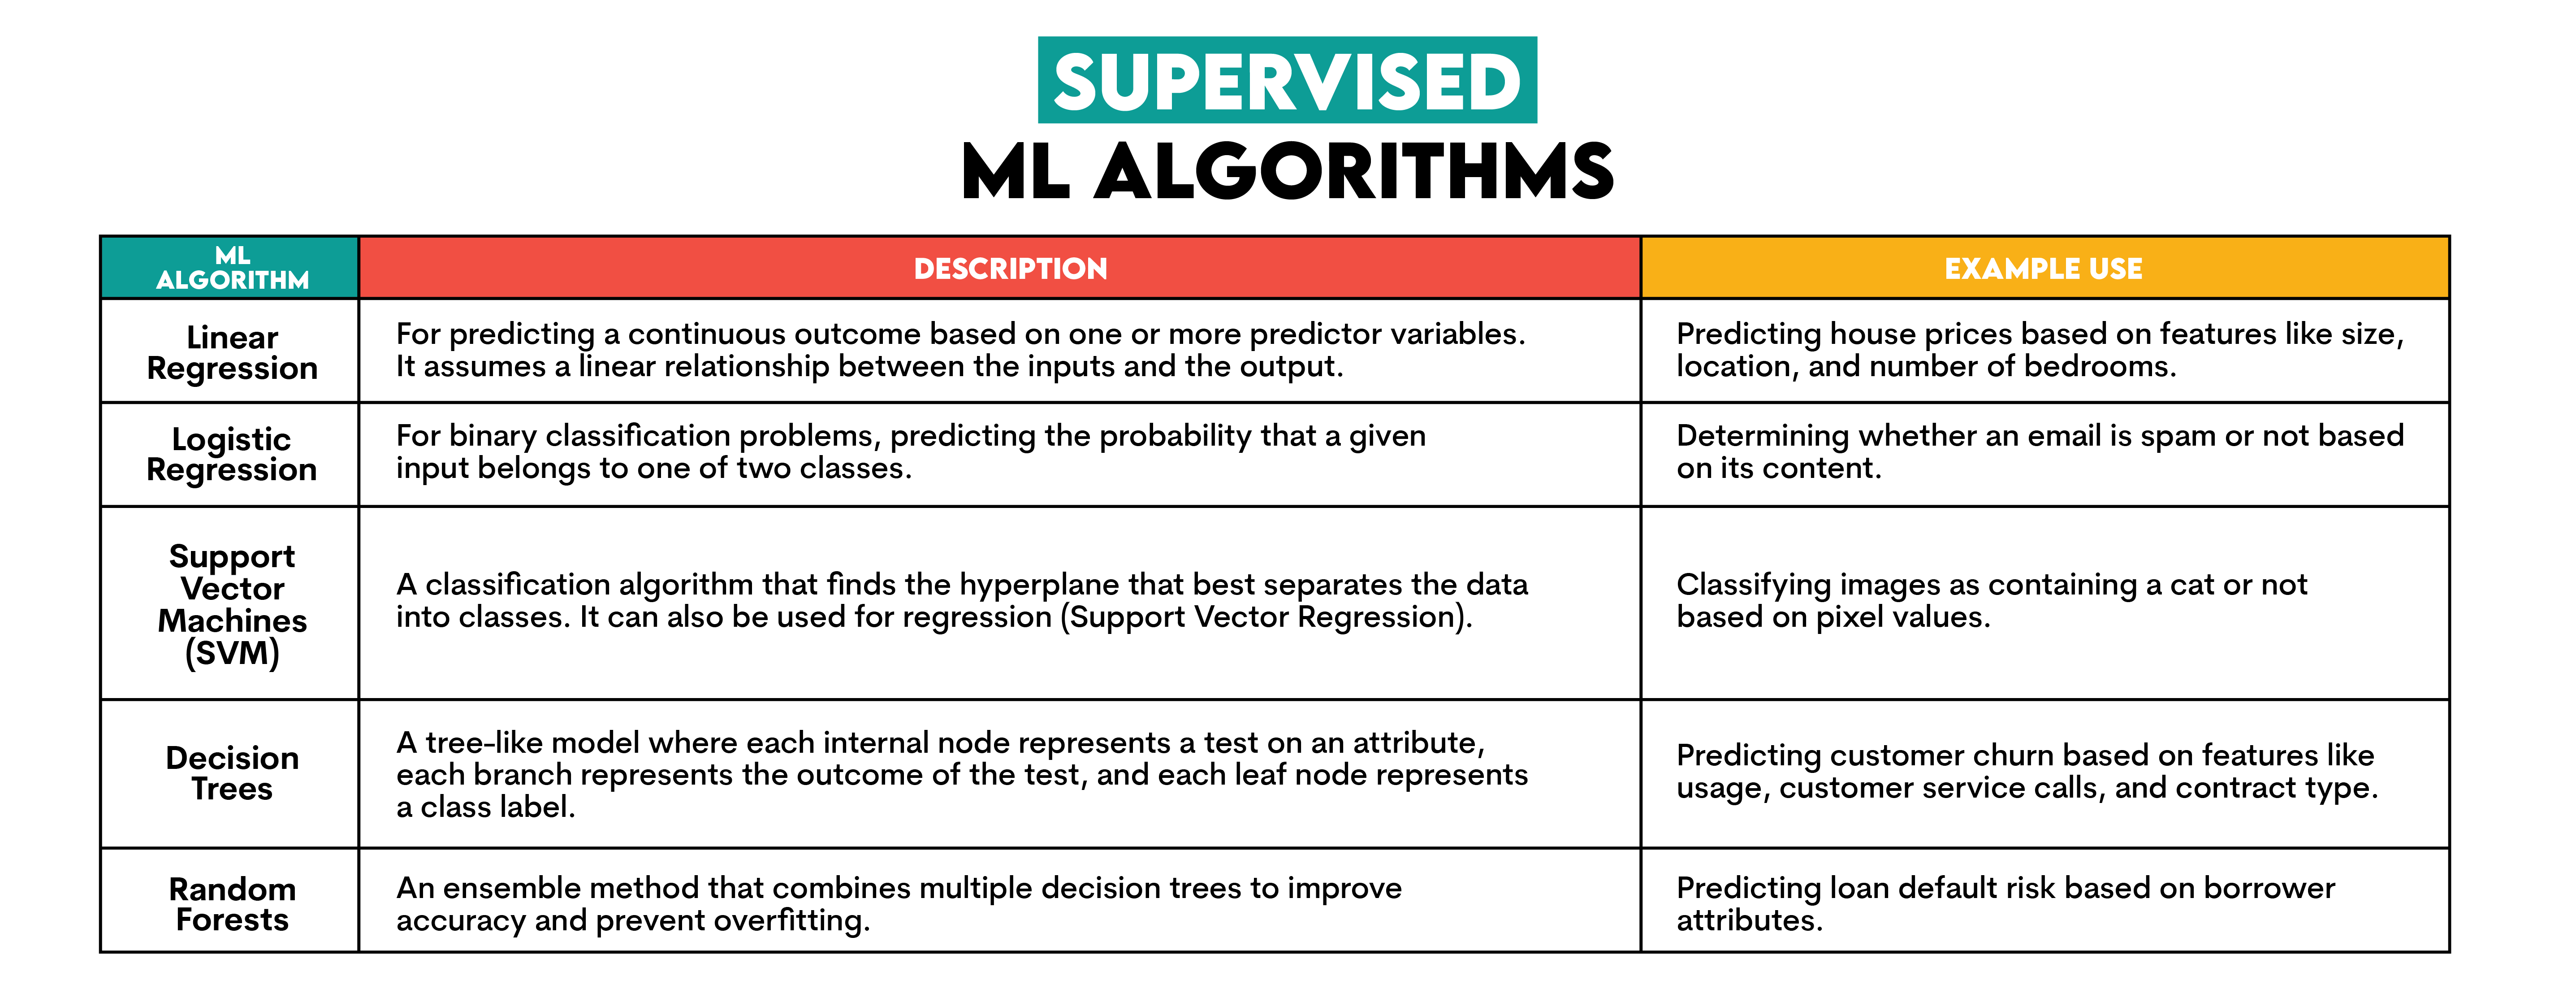
1. Supervised Machine Learning Algorithms
In simple terms, supervised learning is when algorithms learn from labeled data, meaning each training example is matched with an output label. The goal is for the model to learn from these examples and then make accurate predictions on new data.
Here’s an overview of some common supervised learning algorithms and how they can be used.

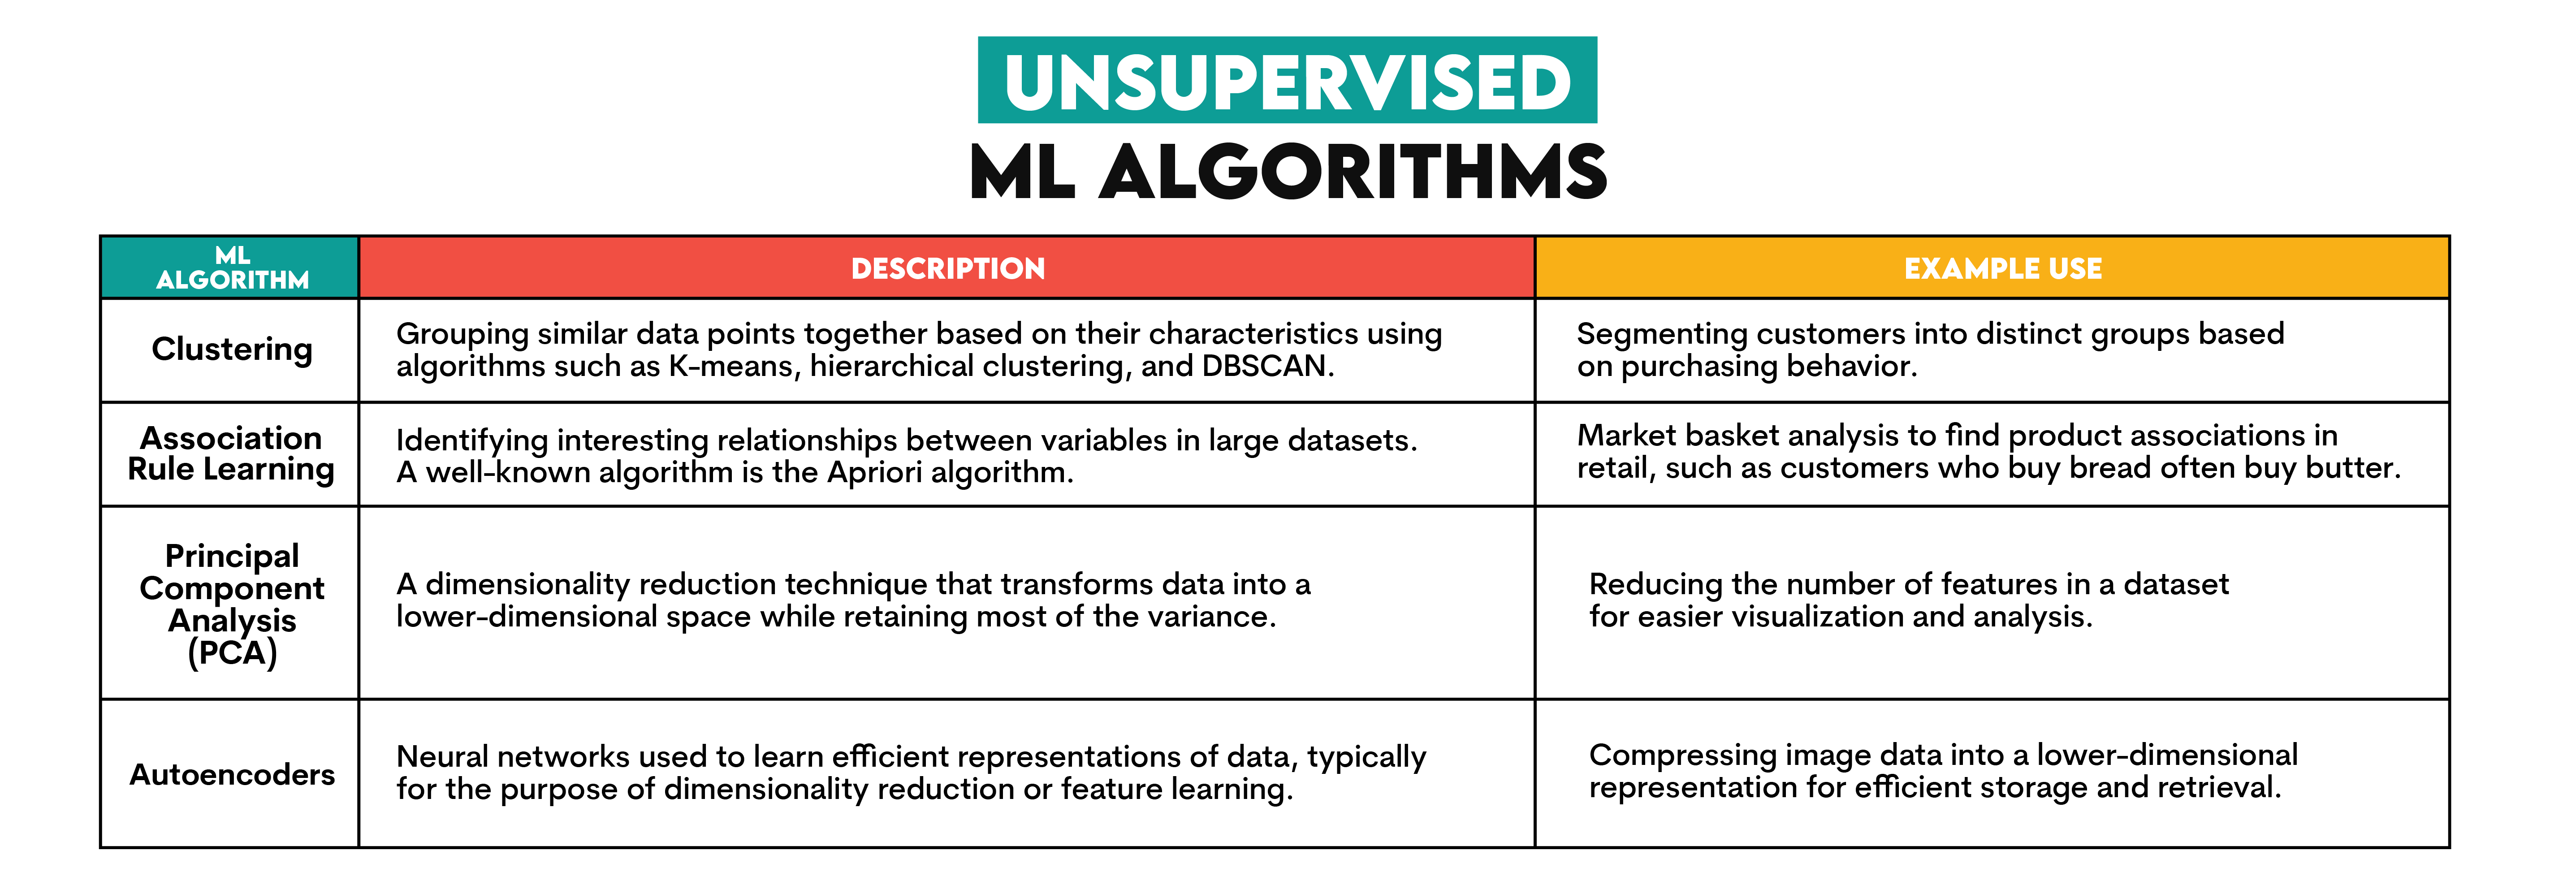
2. Unsupervised Machine Learning Algorithms
Unlike supervised learning, unsupervised ML algorithms learn on unlabeled data, attempting to find hidden patterns within the data. In other words, the outcomes are not predefined.
The most common such algorithms are given here.

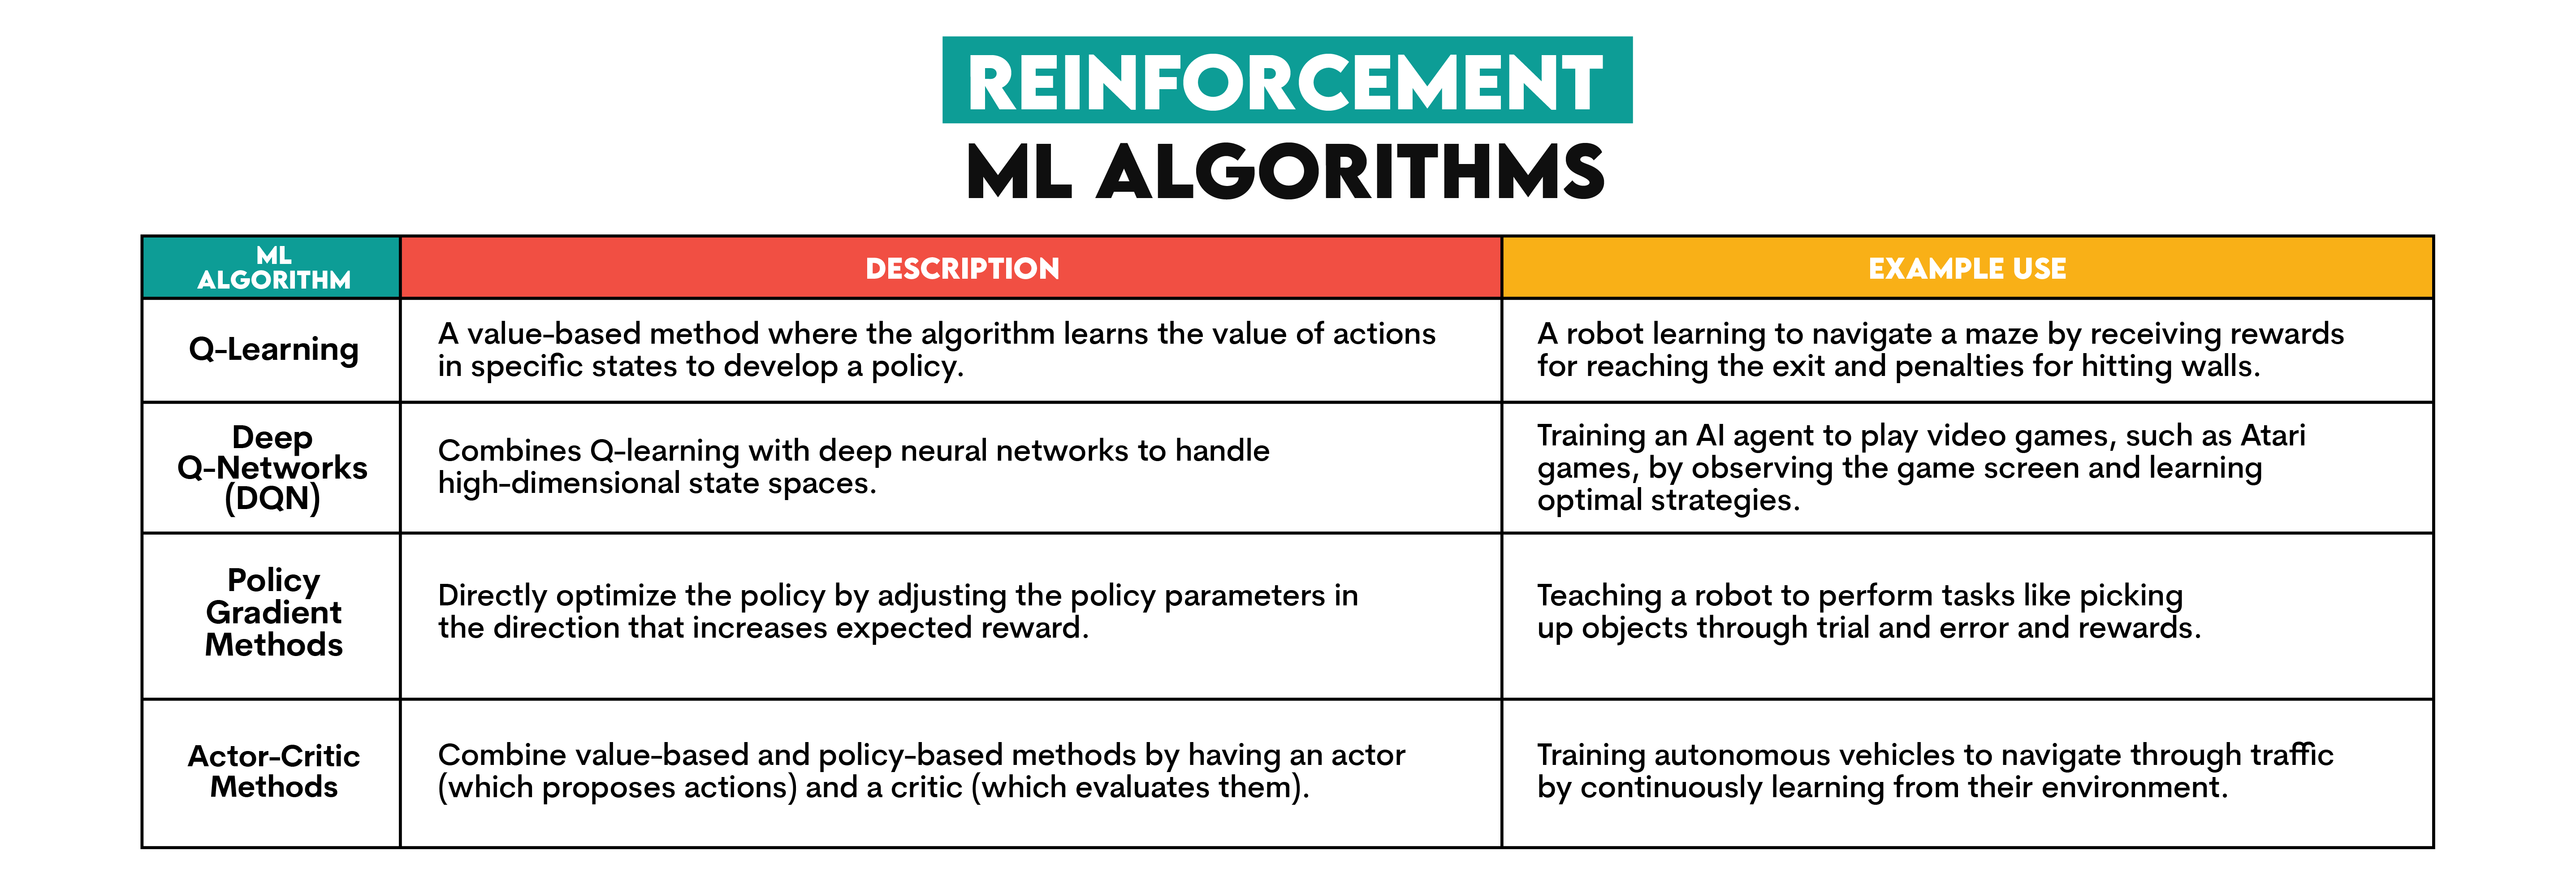
3. Reinforcement Machine Learning Algorithms
If you associate the word ‘reinforcement’ with training dogs, you’re right. Training reinforcement algorithms is like training your dog, sort of. Like your dog interacts with the world and, depending on it, gets negative or positive reinforcement (e.g., a treat), the same is true with the algorithms. If the model’s prediction is marked as a desirable outcome, then the model gets a reward. In case of the non-desirable outcomes, it gets penalized.
You can find the overview of the algorithms below.
Additional Advanced ML Techniques in Business Analytics
Along those three main types of machine learning, some other techniques are also relatively commonly used in BA.
1. Text Analytics: Using natural language processing (NLP) to extract information from textual data, e.g., sentiment analysis, to work out customer opinions on a product from their comments on social media.
2. Simulation Modeling: Simulation modeling involves creating a virtual version of the company’s system and testing different scenarios. It allows for assessing risk and testing outcomes of different decisions in a controlled environment.
3. Prescriptive Analytics: It suggests steps needed to achieve desired outcomes by using optimization and simulation techniques.
BA Key Component #3: Data Mining
Data mining is a set of methodologies for digging into large datasets and uncovering patterns, correlations, and relationships that are useful to decision-making.
One common technique used in data mining is association rule learning, which identifies interesting relationships between variables in a dataset. This technique is commonly used in market basket analysis, where the goal is to learn which products are frequently bought together.
Classification and clustering are also common techniques used in data mining; you should know them from machine learning. Classification puts items in classes based on their attributes. This approach is very helpful in spam detection, image recognition, and medical diagnosis. Clustering, on the other side, groups data points together based on their characteristics. A typical use of clustering is customer segmentation, image segmentation, and anomaly detection.
Some additional techniques used in data mining worth mentioning are regression analysis (predicting an outcome of a continuous variable), text mining (using NLP to extract information from text), and dimensionality reduction (reducing the number of variables under consideration by obtaining principal variables)
Business Intelligence Key Components
Since the main goal of BI revolves around historical reports on performance, it’s no wonder the three main BI components support this goal.

BI Key Component #1: Dashboards
Dashboards are static or interactive visualizations that provide an overview of key performance indicators (KPIs) and other performance metrics. Their purpose is to give users information about the company’s performance (or of its segment) at one glance.
In simple terms, a dashboard is a collection of neatly organized charts, graphs, and other visual elements.
Dashboards can be used for real-time performance monitoring (e.g., real-time inventory levels) and can be customized by the user (e.g., filtering date range, geographic location, and product category) to focus on the data most relevant to them, which also means the interactivity of such visualizations.
BI Key Component #2: Scorecards
Scorecards are reports structured to measure an individual’s or department’s performance against specific goals and objectives. Usually, the balanced scorecard approach is used, the one that assesses performance from different perspectives, e.g., financial and non-financial measures.
Aside from regularly measuring performance, scorecards make sure the organization’s segments are working together toward the overall strategy and objectives.
BI Key Component #3: Data Warehousing
Data warehousing is a concept and practice of integrating data from multiple sources (e.g., transactional databases, CRM systems, ERP systems, external data feeds) into a central place called a data warehouse.
Large amounts of historical data being stored centrally allows for easier data access, quality, and consistency, which is crucial for data analysis and reporting.
Business Analytics vs Business Intelligence: Technology and Tools
The two stages of business analytics and business intelligence processes overlap: data collection & integration and data cleaning & preparation.
Business analytics can perform these steps independently, but it commonly works with data that business intelligence has already collected and cleaned.
This means the same tools are used in these two stages. Let’s quickly overview them, and then we’ll discuss the tools that define the BA and BI goals.
The tools commonly used for collecting and integrating data in both BA and BI are:
- SQL - for querying and managing relational databases
- Talend – ETL tool
- Informatica – data integration platform
- Apache Hadoop – for distributed storage and processing of large datasets
- Apache Spark – analytics for large-scale data processing
When it comes to data cleaning and preparation, BA and BI often use:
- Python – using pandas and NumPy libraries
- R – using dplyr and tidyr libraries
- SAS – data management and preparation
- Alteryx – a tool for data blending and advanced data preparation
Here, BA and BI diverge as they both enter phases that define them; BA employs tools for statistical analysis and predictive modeling, while BI uses BI tools to report and visualize data.
Let’s have a detailed look at those tools.
Business Analytics Tools for Statistical Analysis and Predictive Modeling

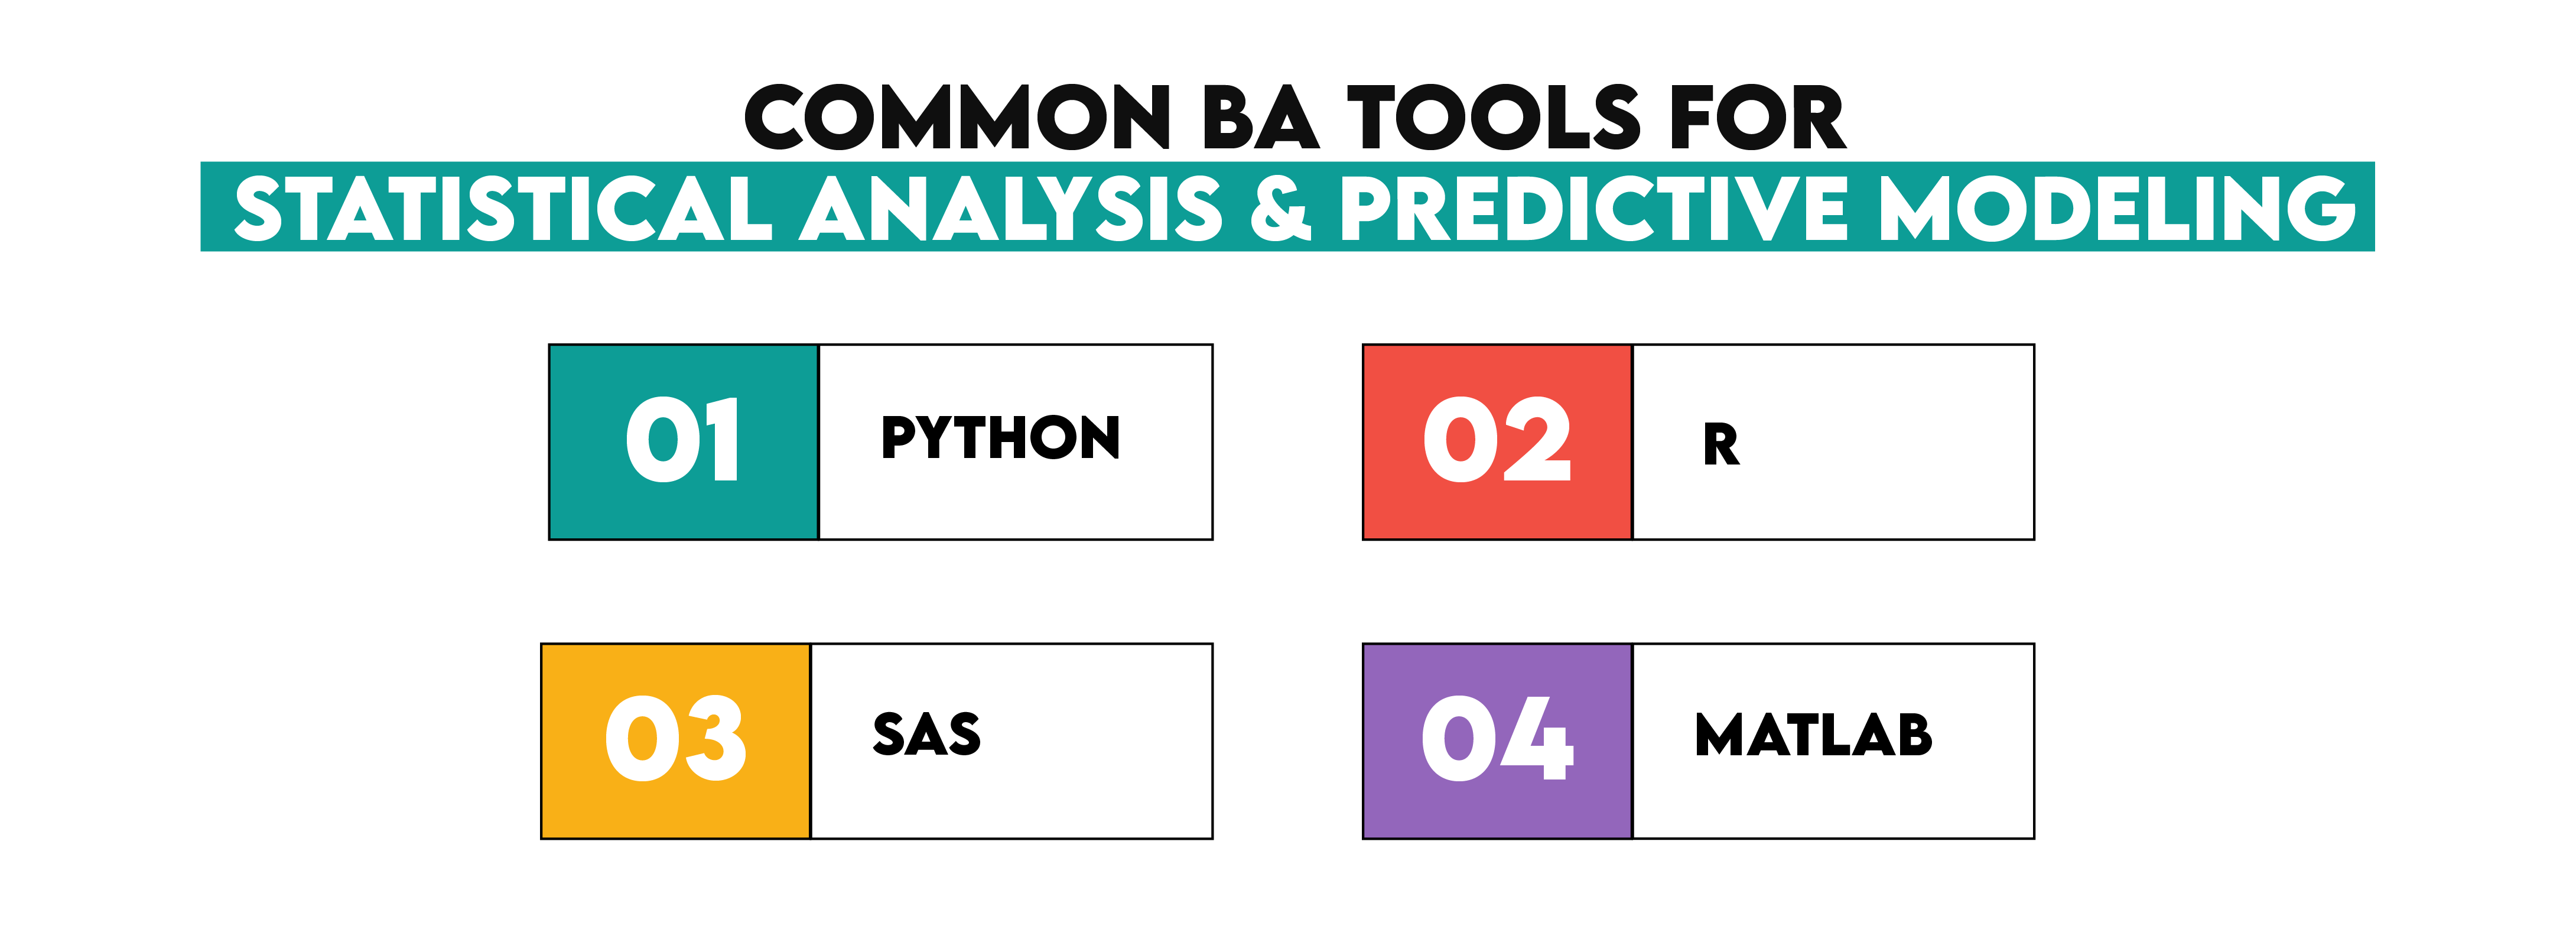
Python is a very versatile programming language that is a go-to tool for data analysis and machine learning, among other uses. What makes it so powerful is a wide range of libraries for these purposes:
- Data analysis:
- ML:
- scikit-learn – general-purpose ML
- TensorFlow – deep learning and neural networks
- Keras – high-level neural networks API
- PyTorch – deep learning and neural networks
- XGBoost – for optimized distributed gradient boosting
- LigthGBM – gradient boosting
Another commonly used tool is the R programming language. It was specifically developed for statistical computing and graphics. It has built-in data analysis tools, such as linear and nonlinear modeling, time-series analysis, classification, and clustering. It’s also known for a range of packages that extend its capabilities, such as dplyr and tidyr for data manipulation.
SAS (Statistical Analysis System) is software for advanced statistical analysis, predictive modeling, and machine learning. It comes with statistical procedures for data analysis, including descriptive statistics, inferential statistics, regression analysis, and multivariate analysis. When it comes to advanced analytics, you can do time series analysis, survival analysis, categorical data analysis, and Bayesian analysis with it. It also offers a wide range of ML algorithms for classification, regression, clustering, and association.
MATLAB (Matrix Laboratory) is a language and environment that excels in statistical analysis and algorithm development. It offers toolboxes for data analysis, hypothesis testing, and statistical modeling. Users can also adapt analyses to their needs by writing custom functions. In MATLAB, you can develop, test, and implement classification, regression, clustering, and dimensionality reduction algorithms.
There are also some other tools in business analytics that deserve honorable mention:
- IBM SPSS – statistical analysis and predictive modeling, especially in social silences and market research
- RapidMiner – data preparation, ML, and predictive modeling
- KNIME (Konstanz Information Miner) – data analytics, reporting, and integration
- Alteryx – data blending and advanced analytics
- H2O.ai – ML platform for building predictive models
- TIBCO Statistica – advanced analytics, data mining, and ML
- Minitab – data analysis, especially in quality improvement and Six Sigma projects
- Orange – data mining and ML
- JMP (John’s Macintosh Project) – statistical discovery software
- Azure Machine Learning – building, training, and deploying ML models
Business Intelligence Tools for Data Visualization and Reporting
It is no surprise that the main tools used in BI are BI tools, as they are designed for high-quality data visualization and reporting.

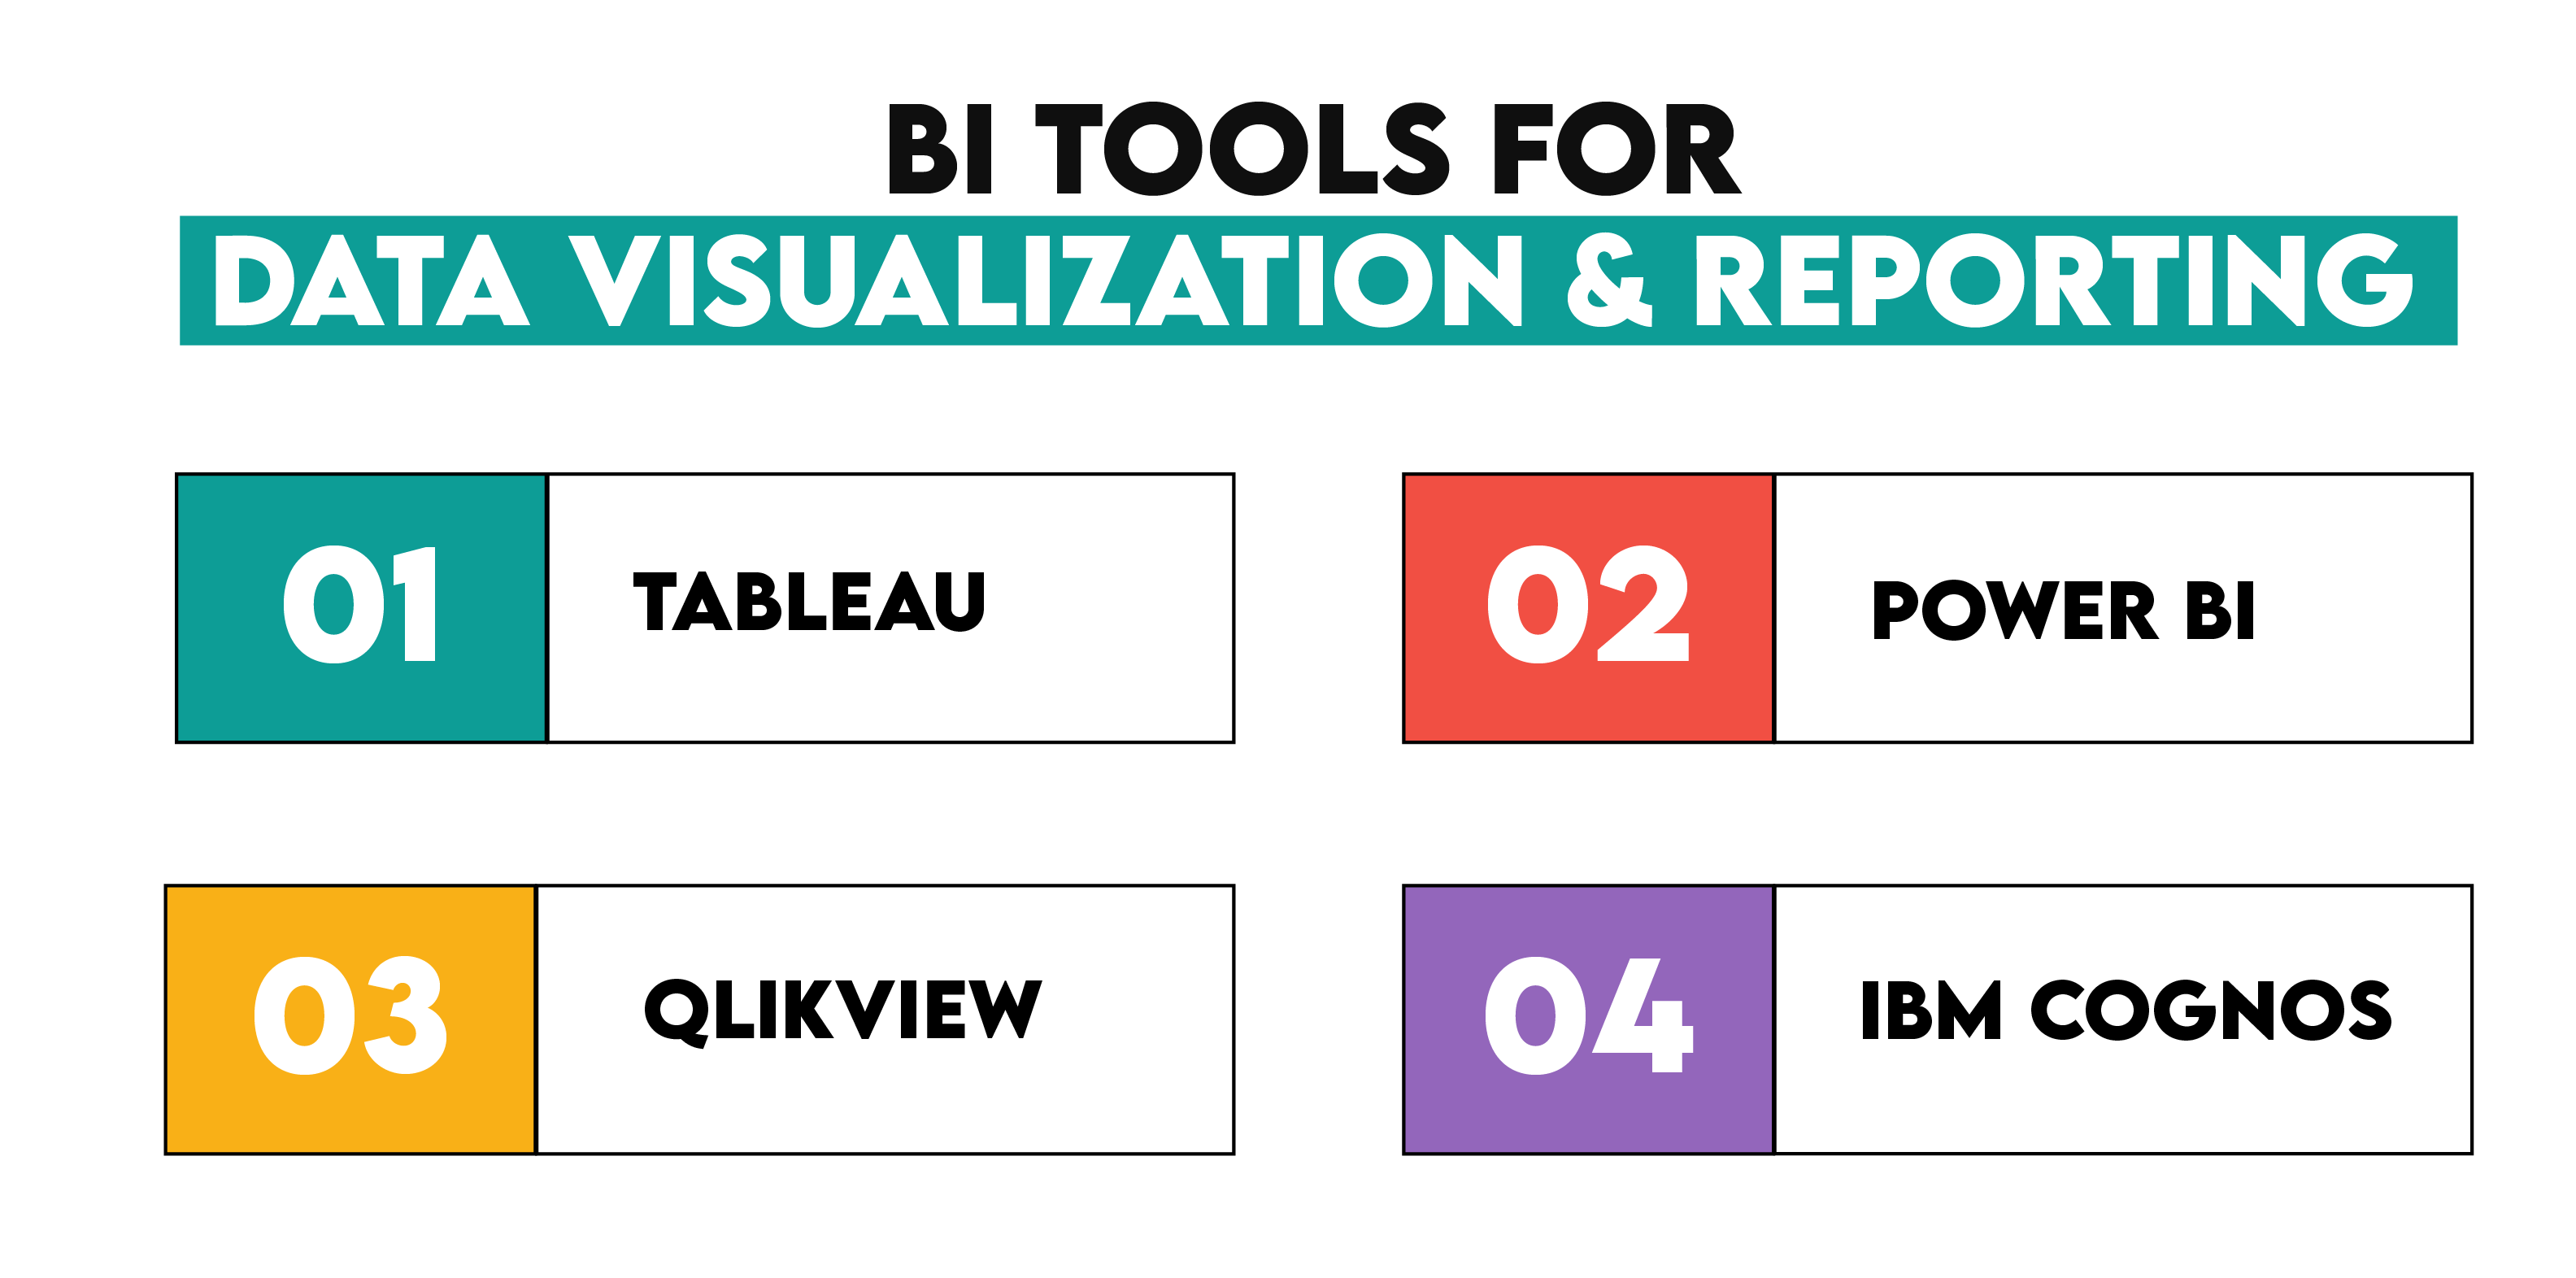
Tableau is one of the most popular BI tools for a reason – users can create and share dashboards using its drag-and-drop interface, so no programming knowledge is required. It also supports interactive dashboards. In addition, Tableau can connect to various data sources, such as databases, spreadsheets, cloud services, and big data platforms.
Power BI is also very commonly used in business intelligence. With it, you can also create and share (interactive) dashboards and connect to various data sources in doing that. Like Tableau, Power BI also has a drag-and-drop interface. Since it’s Microsoft’s baby, Power BI seamlessly integrates with other Microsoft products, e.g., Excel or SQL Server.
QlikView is famous for its associative model that allows users to explore data dynamically and from multiple perspectives. It’s a self-service BI tool, which is the approach that wants to empower users to create their own reports without relying on IT. As with all other BI tools, QlikView connects to various sources.
IBM Cognos is a BI tool that allows reporting, analysis, scorecarding, and performance monitoring. One of its significant advantages is that it’s designed for large-scale data, so it’s most commonly used on an enterprise level.
Honorable mentions are:
- MicroStrategy
- Looker Studio
- Sisense
- Domo
- TIBCO Spotfire
- Zoho Analytics
- Yellowfin BI
- Oracle Business Intelligence (OBI)
- Dundas BI
How Business Analytics and Business Intelligence Complement Each Other
Despite focusing on the distinct tools characteristic of BA and BI, the previous section showed you that they also have a common ground: data collecting and cleaning.
When it comes to the differences we mentioned, that doesn’t mean that business analytics and business intelligence pull into different directions. No, these differences complement each other, making BA and BI work together perfectly by improving the organization’s data use and decision-making.
When integrated, this is how business analysis and business intelligence make business better.

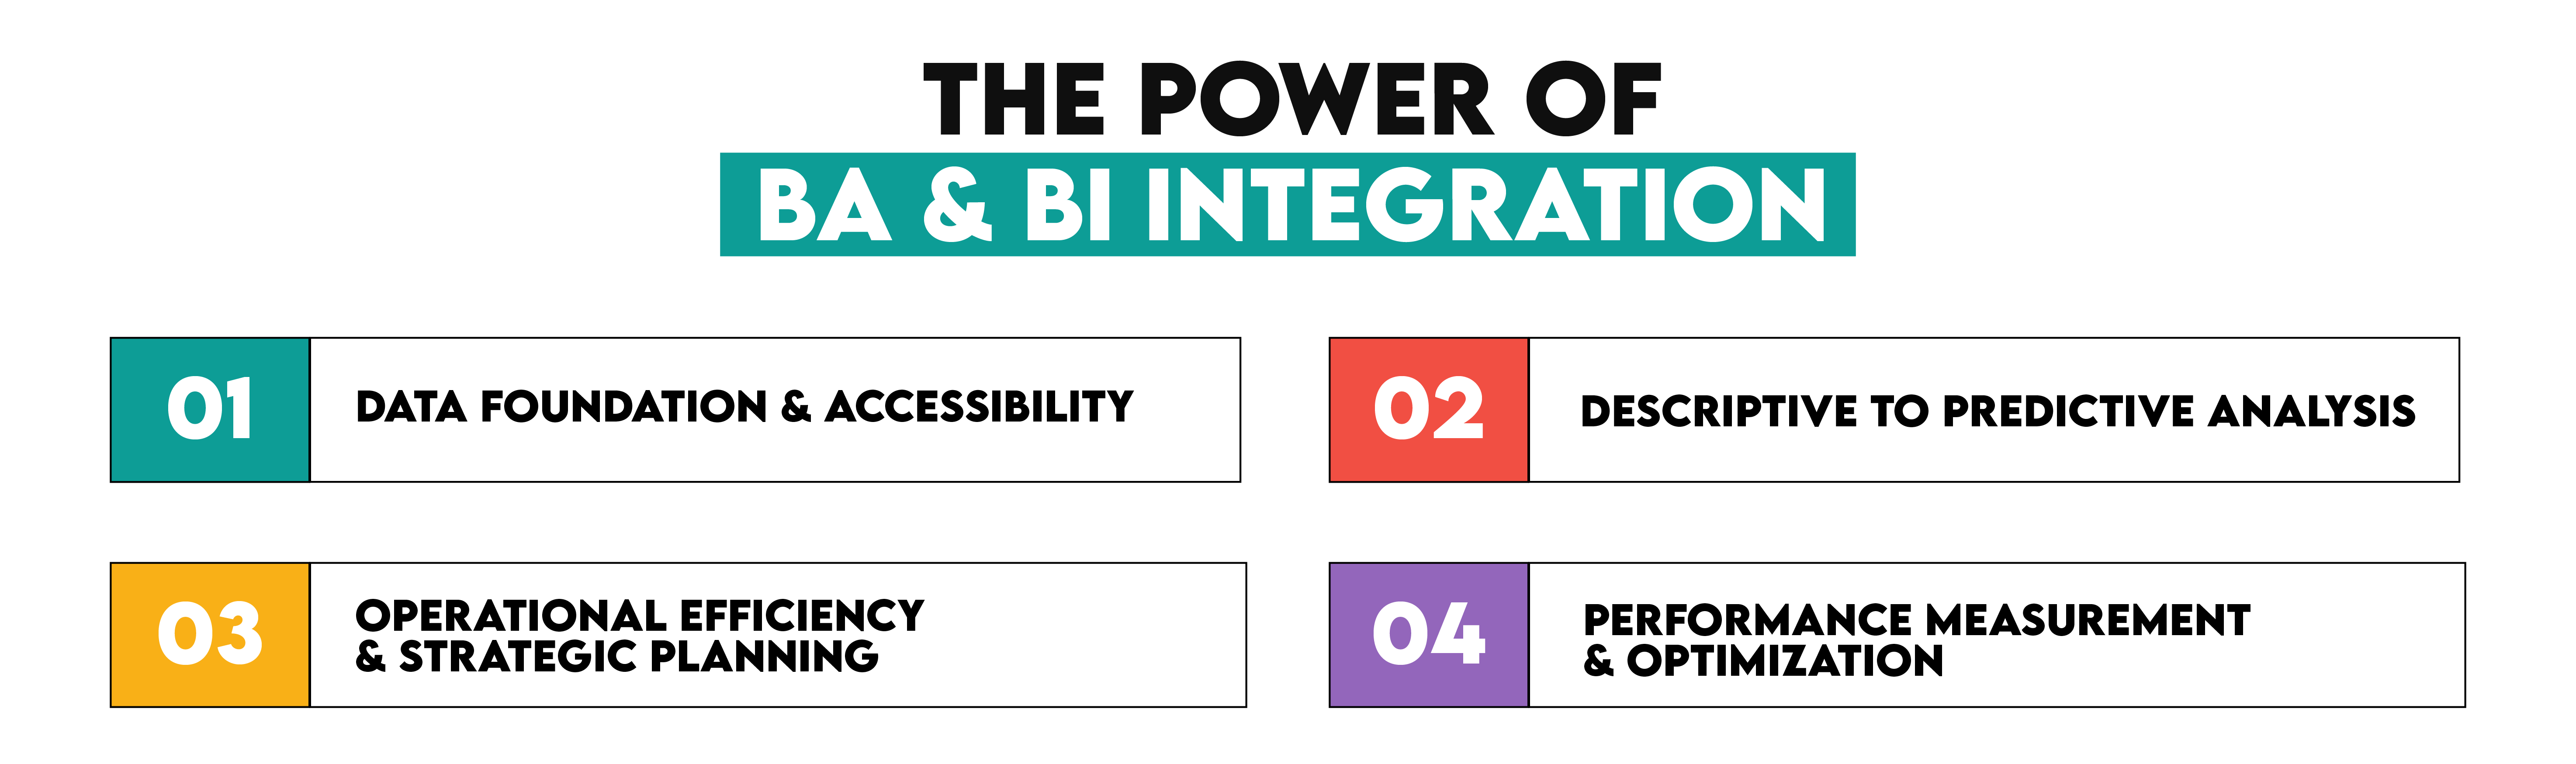
Data Foundation and Accessibility
BI lays the data foundation by ensuring data quality and availability across the organization. After the data is collected, integrated, and presented, BA comes in, builds on this, and goes even deeper into data to uncover insights required to predict future outcomes. If the historical data is reliable, the predictive models can be reliable, too; without it, they are nothing!
Descriptive to Predictive Analysis
Business intelligence provides organizations with descriptive analysis so they can understand what happened. Business analytics takes it a step or two further; it applies predictive analytics to tell decision-makers what will happen. It can even engage in prescriptive analytics to advise on what the company should do to maximize the benefits of what will happen or minimize the negative impacts.
With BI, companies can reveal their areas of strength and potential issues. While this is good, it’s still a passive, reactive approach. Add BA to the mix, and your organization becomes proactive.
Operational Efficiency and Strategic Planning
With BI, you can improve operational efficiency via real-time performance monitoring. BA takes that as a basis and optimizes long-term strategic planning by giving insight into the future.
Performance Measurement and Optimization
Business intelligence is a tool for measuring performance and comparing it to goals. Business analytics uses this performance to identify areas that require improvement. It also tests different optimization strategies through simulations and scenario analysis.
Conclusion
The main difference between business analytics and business intelligence is their perspective. Business analytics looks into the future and predicts it, while business intelligence looks into the past and describes it. This is a huge difference that makes BA and BI two very different territories.
Due to this, BA very often employs machine learning techniques, unlike BI. To practice these skills, solve some of our data projects.
However, there are also similarities; SQL, Python, and R are common both in business analytics and business intelligence. You can practice all these programming languages by solving our coding interview questions.
All those similarities and differences between BA and BI work together great! Only by employing both business analytics and business intelligence will a company have a complete picture and be able to make informed decisions.
Share